I had just finished looking at what electricity actually costs to generate in Britain.
That research surprised me. New onshore wind and large solar really can be very cheap ways to produce bulk electricity. Existing French nuclear can be competitive too. Gas remains useful because it can respond when the system needs it.
Then the obvious question arrived.
If some of the electricity is cheap, why are household energy bills still so much higher than they were before the crisis?
The political answers are wonderfully tidy.
One side says it is all Putin and gas. Another says it is all net zero and green levies. Another says it is profiteering. Another says Britain simply stopped producing its own energy.
The evidence does not support any one of those as the complete answer.
The short version is this:
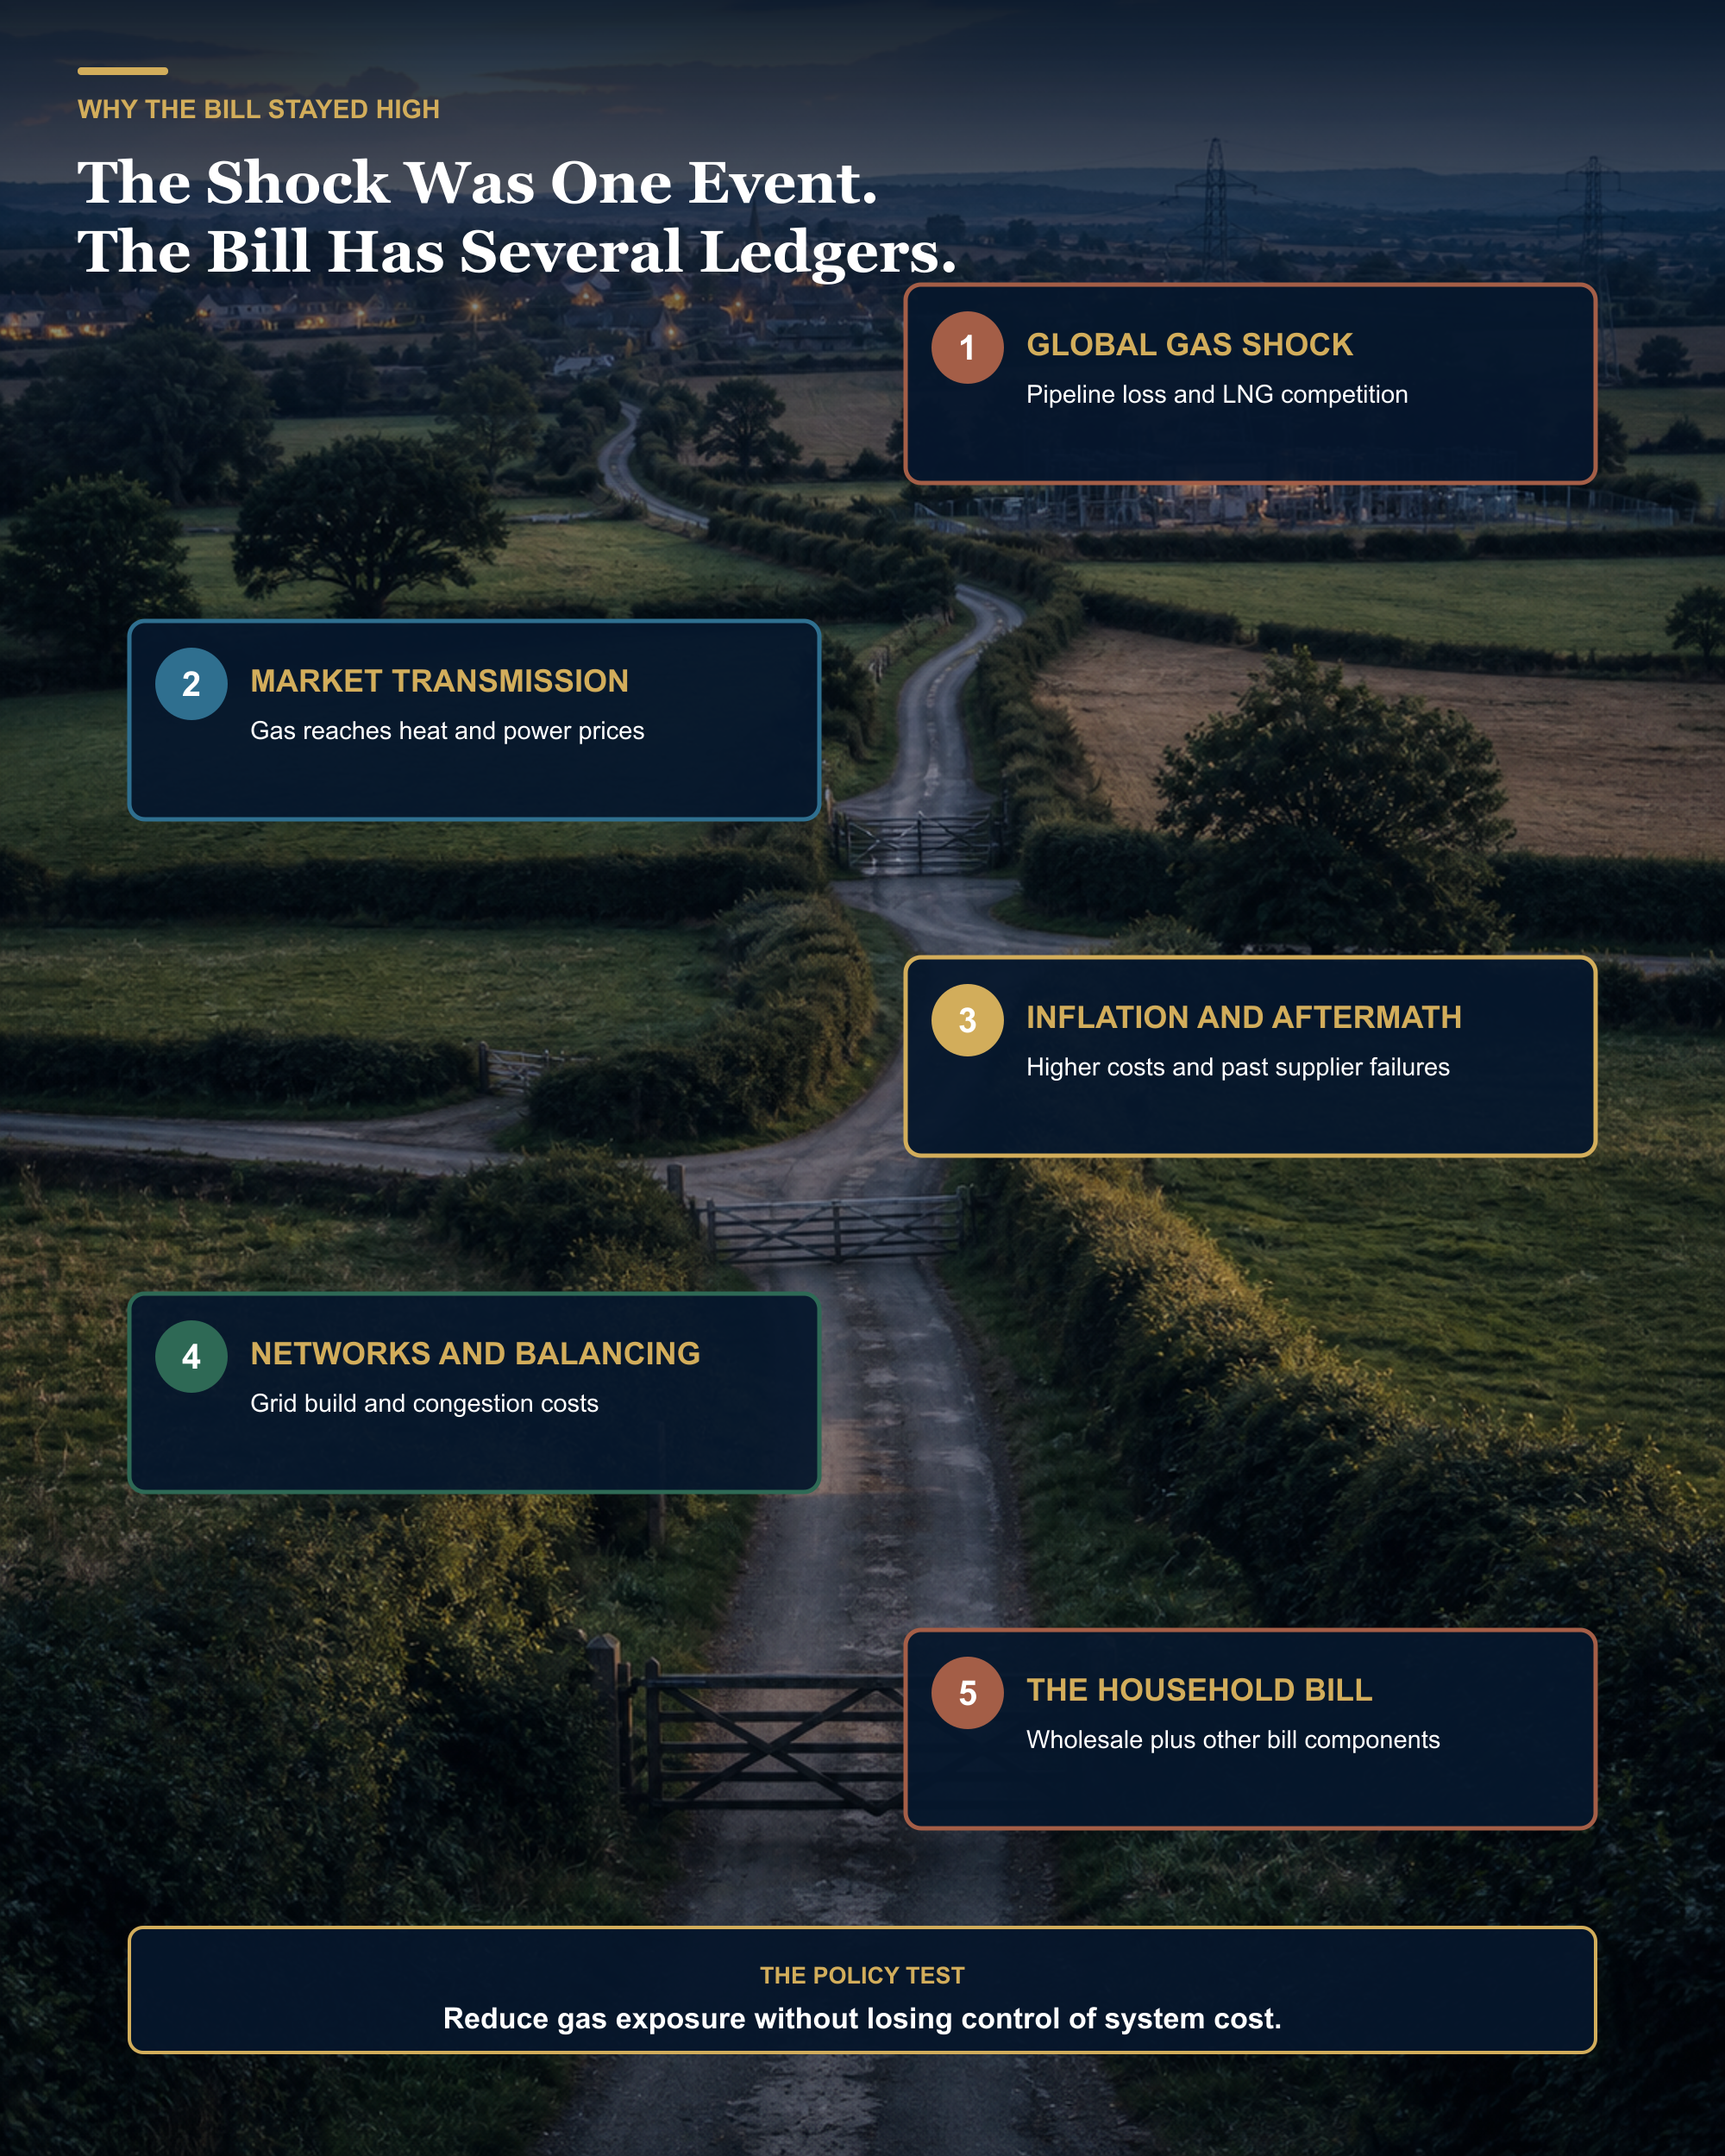
The original surge was overwhelmingly a wholesale gas shock. The changed European gas market, Britain's continuing use of gas, inflation, networks, balancing and debt all help explain why bills did not simply return to 2019. The evidence does not allocate every pound of the 2019-to-2025 gap among those causes. The transition away from gas adds real costs as well as avoiding fuel costs. Moving a charge from the bill to taxation can lower the bill without making the cost disappear.
This article uses public information available on 15 August 2026. It focuses on household gas and electricity bills. The fixed-consumption history is a UK series; most price-cap evidence applies to Great Britain because Northern Ireland has a separate retail market. Business electricity prices are a related but different problem.
The price really did move
The Department for Energy Security and Net Zero publishes annual bill estimates using fixed consumption. That matters because it holds energy use steady and lets us see the change in price rather than confusing it with households using more or less energy.
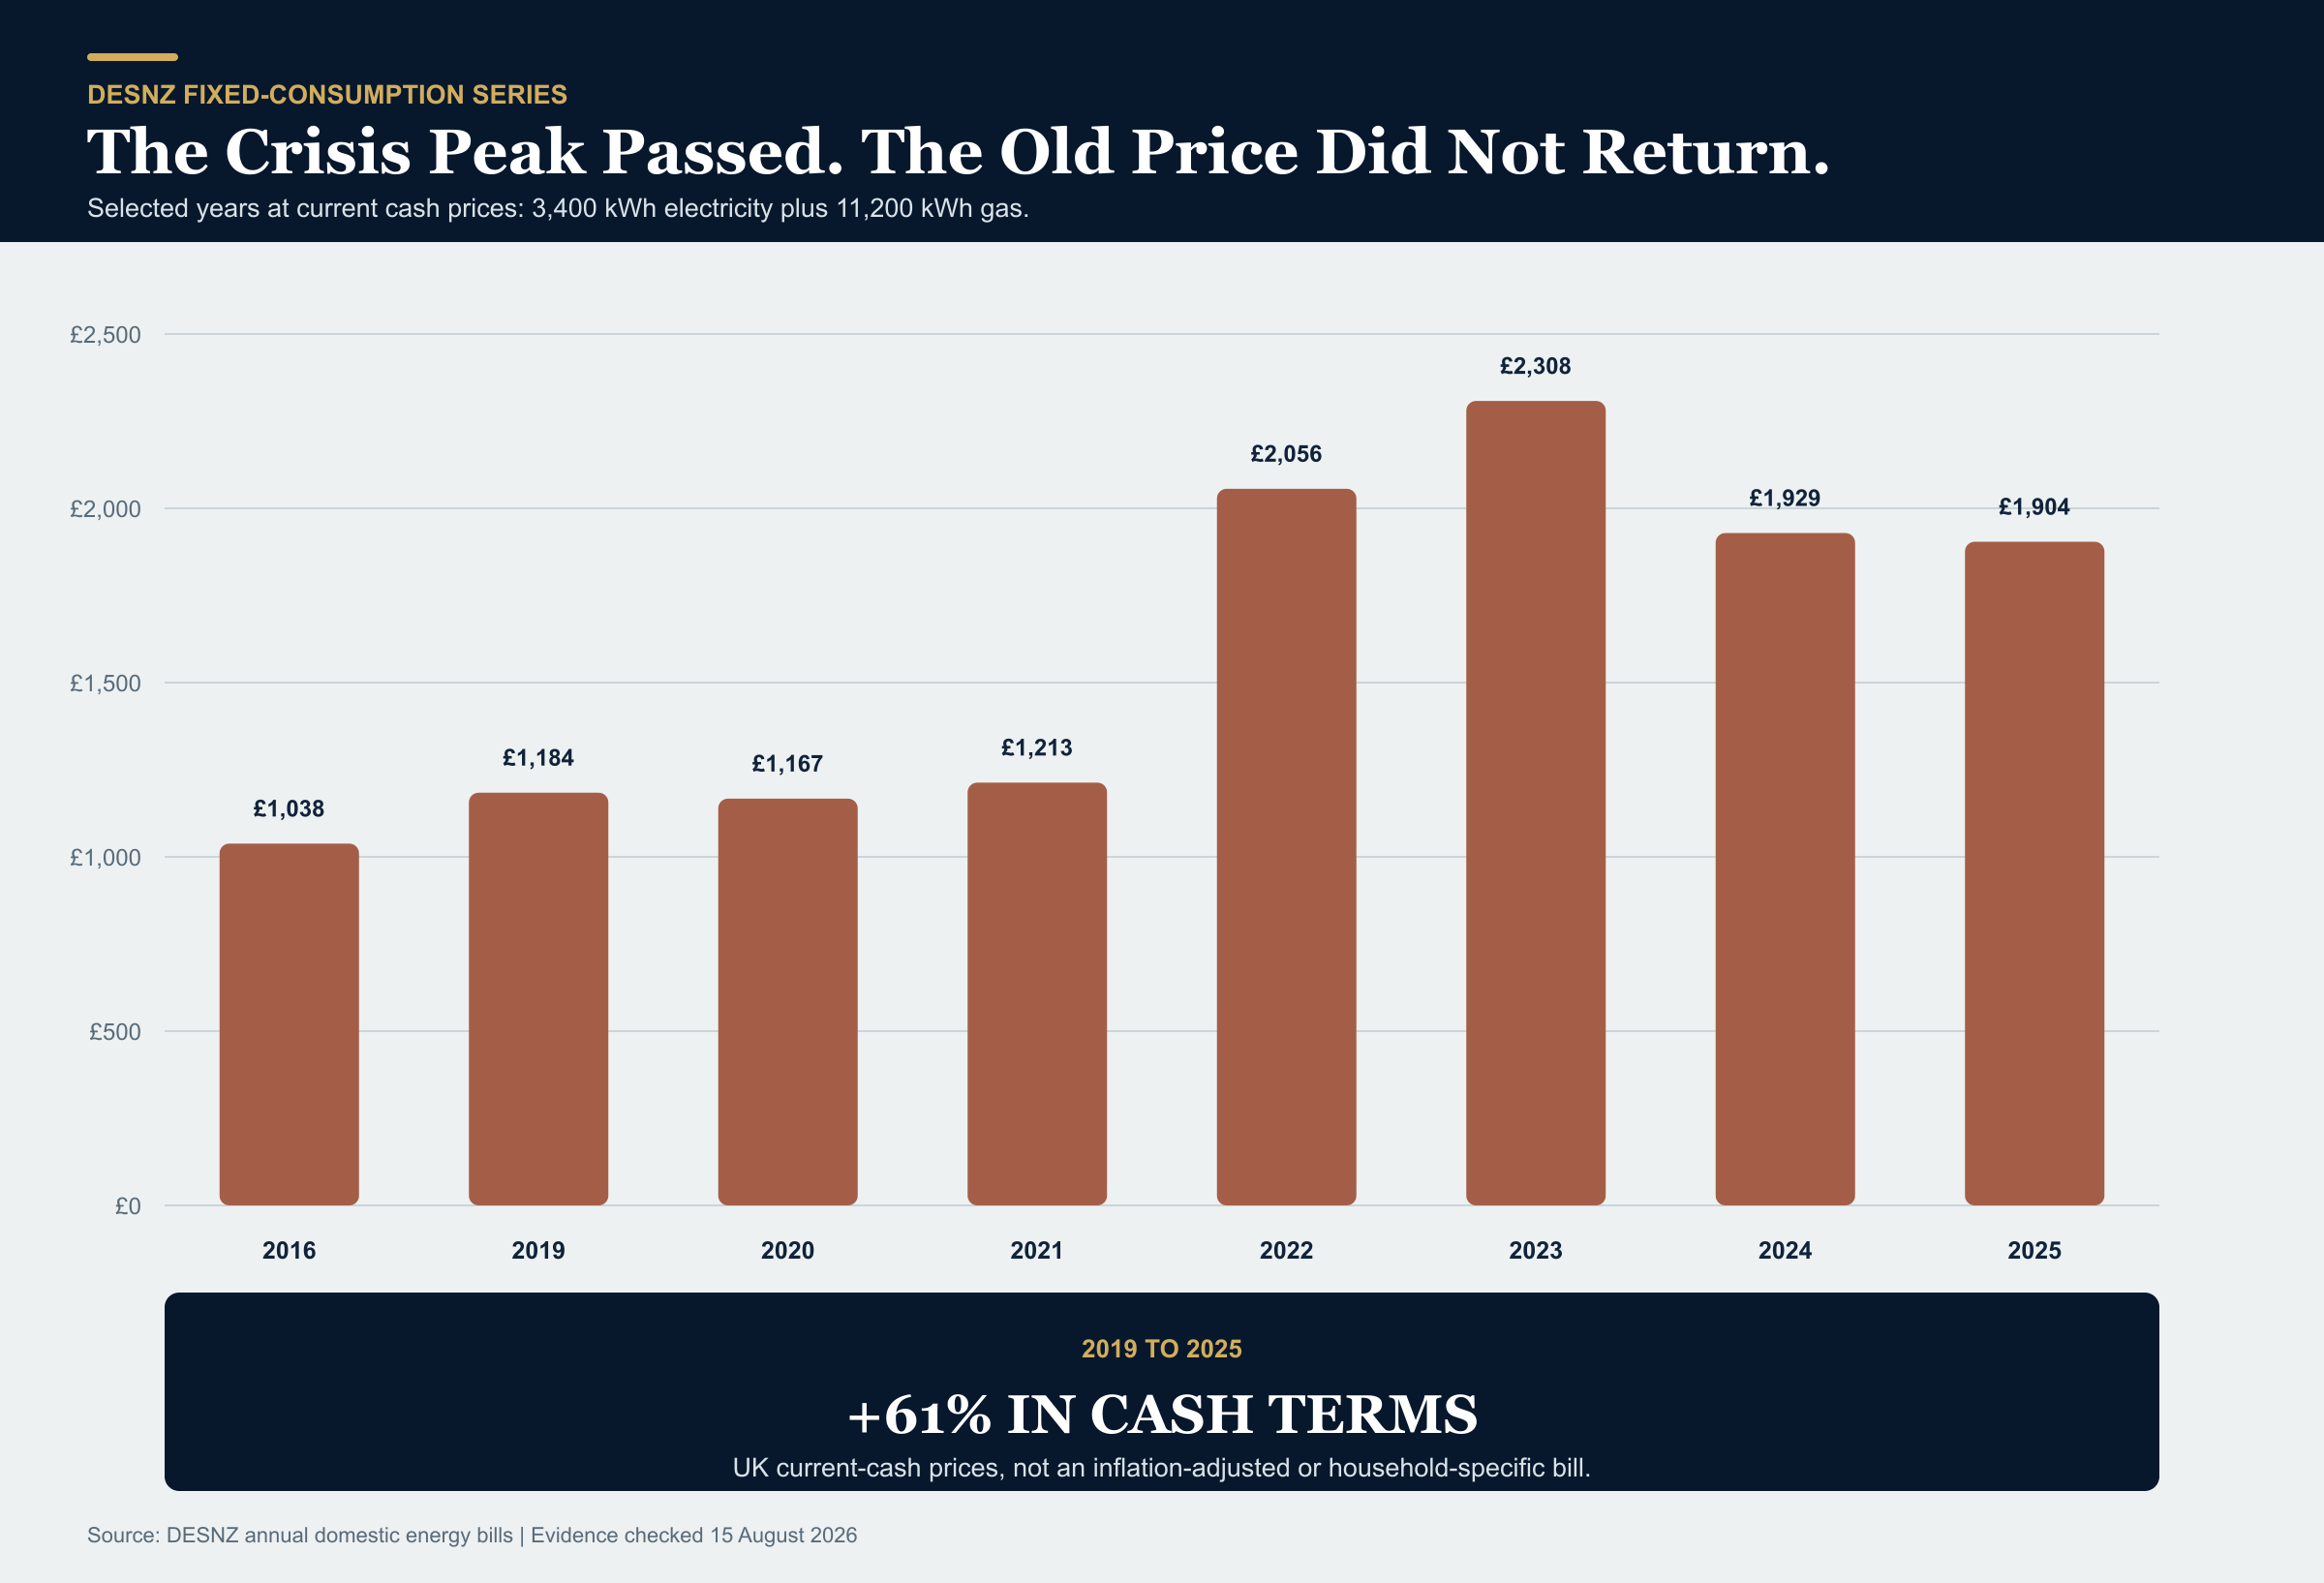
| Year | Electricity, 3,400 kWh | Gas, 11,200 kWh | Combined | Combined versus 2019 |
|---|---|---|---|---|
| 2016 | £531 | £507 | £1,038 | -12% |
| 2019 | £664 | £519 | £1,184 | Baseline |
| 2020 | £671 | £496 | £1,167 | -1% |
| 2021 | £731 | £482 | £1,213 | +2% |
| 2022 | £1,103 | £952 | £2,056 | +74% |
| 2023 | £1,213 | £1,094 | £2,308 | +95% |
| 2024 | £1,083 | £846 | £1,929 | +63% |
| 2025 | £1,069 | £834 | £1,904 | +61% |
Source: DESNZ annual domestic energy bills. These are UK standardised current-cash prices, not the cash paid by every household and not inflation-adjusted values. DESNZ publishes rounded fuel totals, so an electricity and gas pair can differ from the published combined figure by £1. A home with no gas, poor insulation, electric heating, a prepayment meter or unusually high use can have a very different bill.
The separate Quarterly Energy Prices release for June 2026 estimated a combined standard electricity and gas bill of £1,899 for financial year 2025/26 at the same fixed use. It also said prices remained above those seen before the Russia-Ukraine conflict.
The crisis peak therefore came down. It did not return us to the earlier world.
The crisis began before the invasion
Russia's full-scale invasion of Ukraine turned a serious market squeeze into a catastrophe. It did not create the first squeeze.
Gas prices were already climbing during 2021 as economies reopened after the pandemic and demand recovered faster than supply.
The invasion then destroyed the assumption that Europe could continue relying on large volumes of relatively cheap Russian pipeline gas. The International Energy Agency estimates that Russian piped deliveries to the European Union fell by 90% between 2021 and 2025.
Europe replaced much of that missing pipeline supply by becoming a much larger customer in the global LNG market. That was an extraordinary engineering and commercial achievement. It also meant European and British prices became more exposed to weather, shipping, Asian demand and disruption far beyond Europe.
Britain does not need to buy a particular cargo from a particular troubled region for that disruption to matter. LNG cargoes can go to the buyer willing to pay. When global supply tightens, the price of alternative cargoes rises too.
Gas reaches a British bill three times
- Directly through heating: millions of homes still burn gas for heat and hot water.
- Through electricity generation: gas stations remain important when demand is high or renewable output is low.
- Through wholesale price formation: the last, most expensive generator needed to meet demand often sets the wholesale market price.
Ofgem explains that gas can set the Great Britain wholesale electricity price a large majority of the time because the system still needs some gas generation. That does not mean every wind or nuclear generator simply keeps the gas price. Contracts for Difference, bilateral contracts and hedging change what individual generators and suppliers receive or pay. It does mean the marginal gas unit can have an outsized effect on the market price.
This is the slightly odd truth: gas can be less than half the electricity mix and still have a very large influence on electricity prices.
April 2022 tells us what caused the surge
We do not need to guess what drove the first great increase. The price-cap accounts show it.
In April 2022, the standard direct-debit price cap rose by £694, from £1,277 to £1,971. The wholesale allowance rose by £549. That was about 79% of the entire increase.
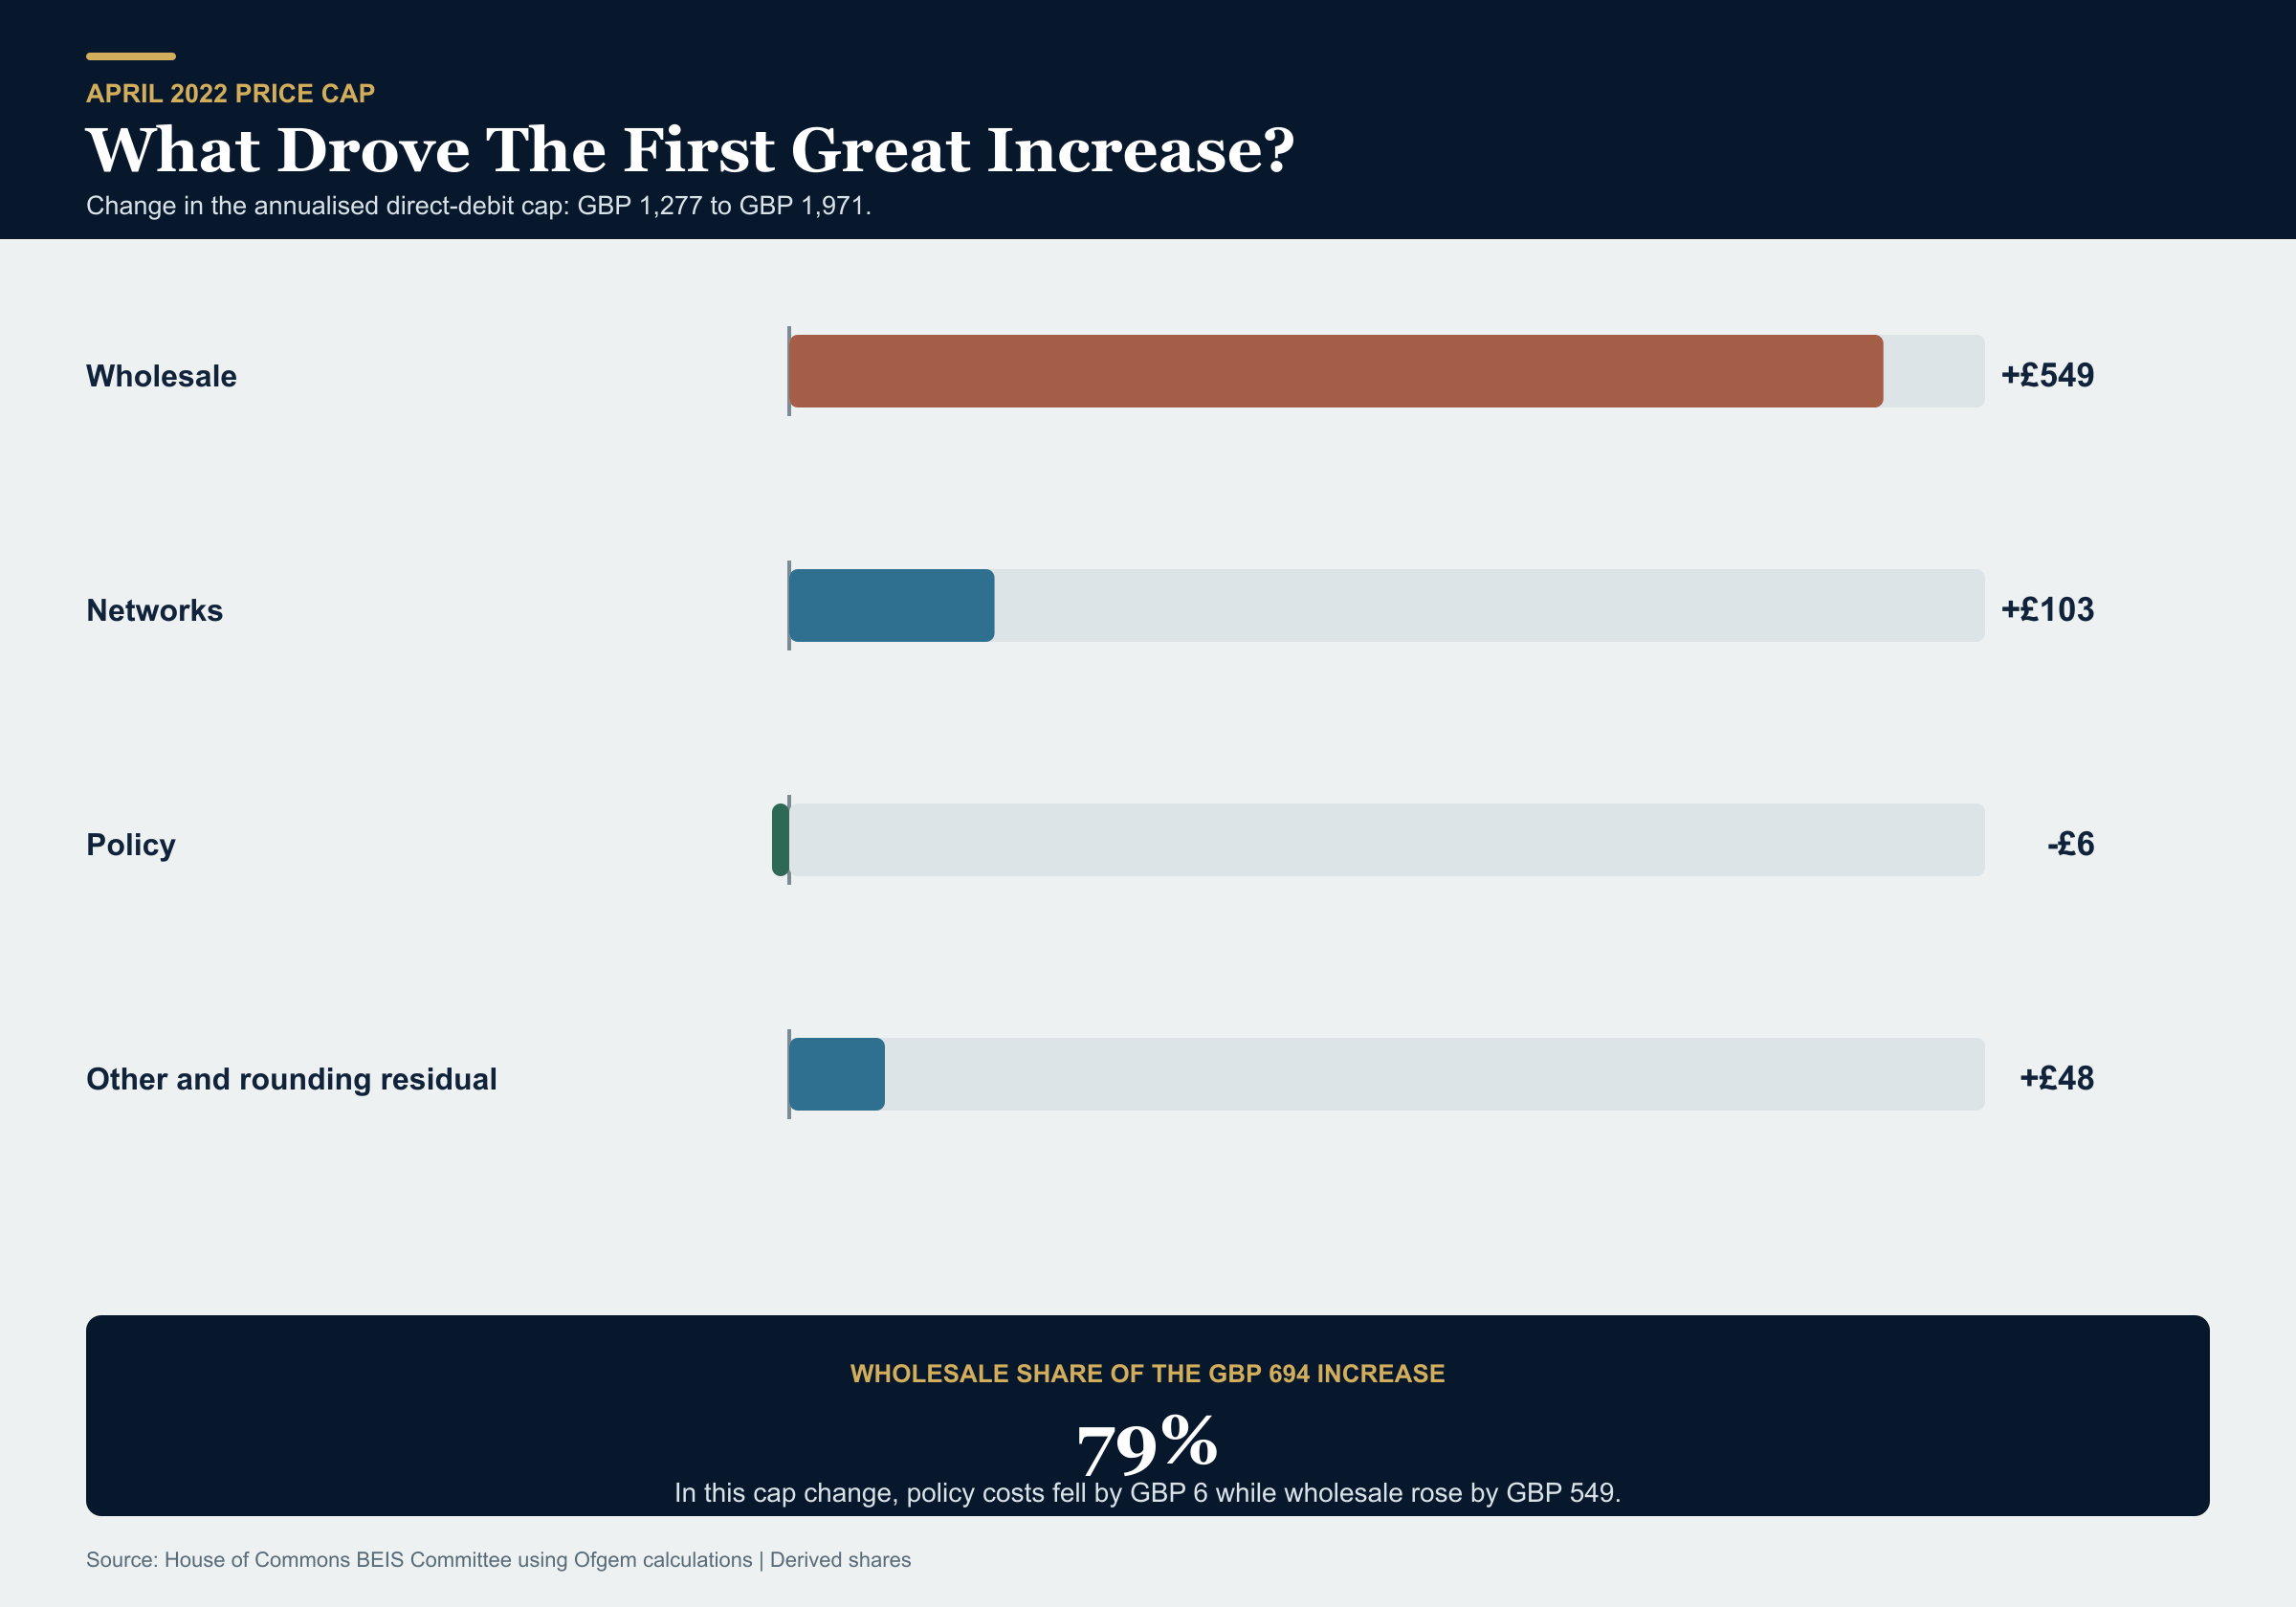
| Component | Earlier cap | April 2022 cap | Change | Share of total increase |
|---|---|---|---|---|
| Wholesale gas and electricity | £528 | £1,077 | +£549 | 79% |
| Networks, including failed-supplier levy | £268 | £371 | +£103 | 15% |
| Policy costs | £159 | £153 | -£6 | -1% |
| Other costs, profit allowance and VAT | Residual | Residual | +£48 | 7% |
| Total | £1,277 | £1,971 | +£694 | 100% |
Source: the House of Commons Business, Energy and Industrial Strategy Committee, drawing on Ofgem's price-cap calculations. Percentages are derived from the published pound changes and may not sum perfectly because of rounding.
That does not settle every argument about energy policy. It settles one narrower question: green levies were not the main cause of the 2022 household-bill explosion.
Why the bill did not simply fall back
There is no official decomposition assigning the full £720 difference between the 2019 and 2025 standardised bills to the causes below. They are documented mechanisms and costs that help explain the result, not slices of one reconciled total.
1. The gas market changed
Prices are far below the panic peaks. Europe is also structurally more dependent on globally traded LNG and less supplied by Russian pipelines than it was in 2019.
Britain has domestic production and large Norwegian pipeline imports. It still trades in an interconnected market. Domestic gas is normally sold at the market value; it does not automatically become cheap gas reserved for British households. More domestic supply can improve security and reduce import requirements, but it is not an automatic return to 2019 prices.
2. Inflation raised the floor
The energy shock helped produce inflation, and inflation then raised the cost of almost everything around the commodity: wages, equipment, finance, call centres, meters, maintenance and network construction.
Wholesale prices can fall quickly. A five-year network programme, a wage bill or a financing contract does not reverse at the same speed.
3. The grid is being rebuilt while it is running
Britain is connecting more generation in places where the existing grid was not designed to carry it. That investment raises network costs now, but failing to build the grid can be expensive too.
NESO's Annual Balancing Costs Report records £2.7 billion of balancing costs in 2024/25, 10% more than the year before. Thermal-constraint costs were £1.7 billion, up 64%. NESO says planned Scottish outages, high wind output and limited transfer capacity all contributed.
It would be misleading to call all £2.7 billion a renewable subsidy. The total includes several kinds of balancing action. It would be equally misleading to pretend that rapid renewable deployment creates no integration cost. Grid bottlenecks are a real cost of building generation faster than the wires needed to move its output.
4. Weak suppliers made the crisis more expensive
The National Audit Office concluded that Ofgem could not have prevented the wholesale shock from reaching consumers, but had not done enough beforehand to make the retail market resilient. Twenty-nine suppliers failed between July 2021 and May 2022, affecting nearly four million households.
Supply continued, which was important. The cost did not vanish. Parts of it were recovered from customers through the system, including through the April 2022 cap. This evidence establishes a crisis-era cost; it does not prove that the same failed-supplier levy remains in the current cap.
5. Energy debt became a system cost
By June 2025, Ofgem reported £4.43 billion of domestic energy debt, 71% more than in 2023. It said a typical direct-debit customer was paying about £52 a year towards managing and writing off energy debt.
This is one of the crueller feedback loops. High prices push some households into debt. The unrecovered debt then adds a cost for the wider customer base.
What is in the current cap?
Ofgem's July to September 2026 breakdown is useful because it shows the bill as a set of ledgers rather than one political object.
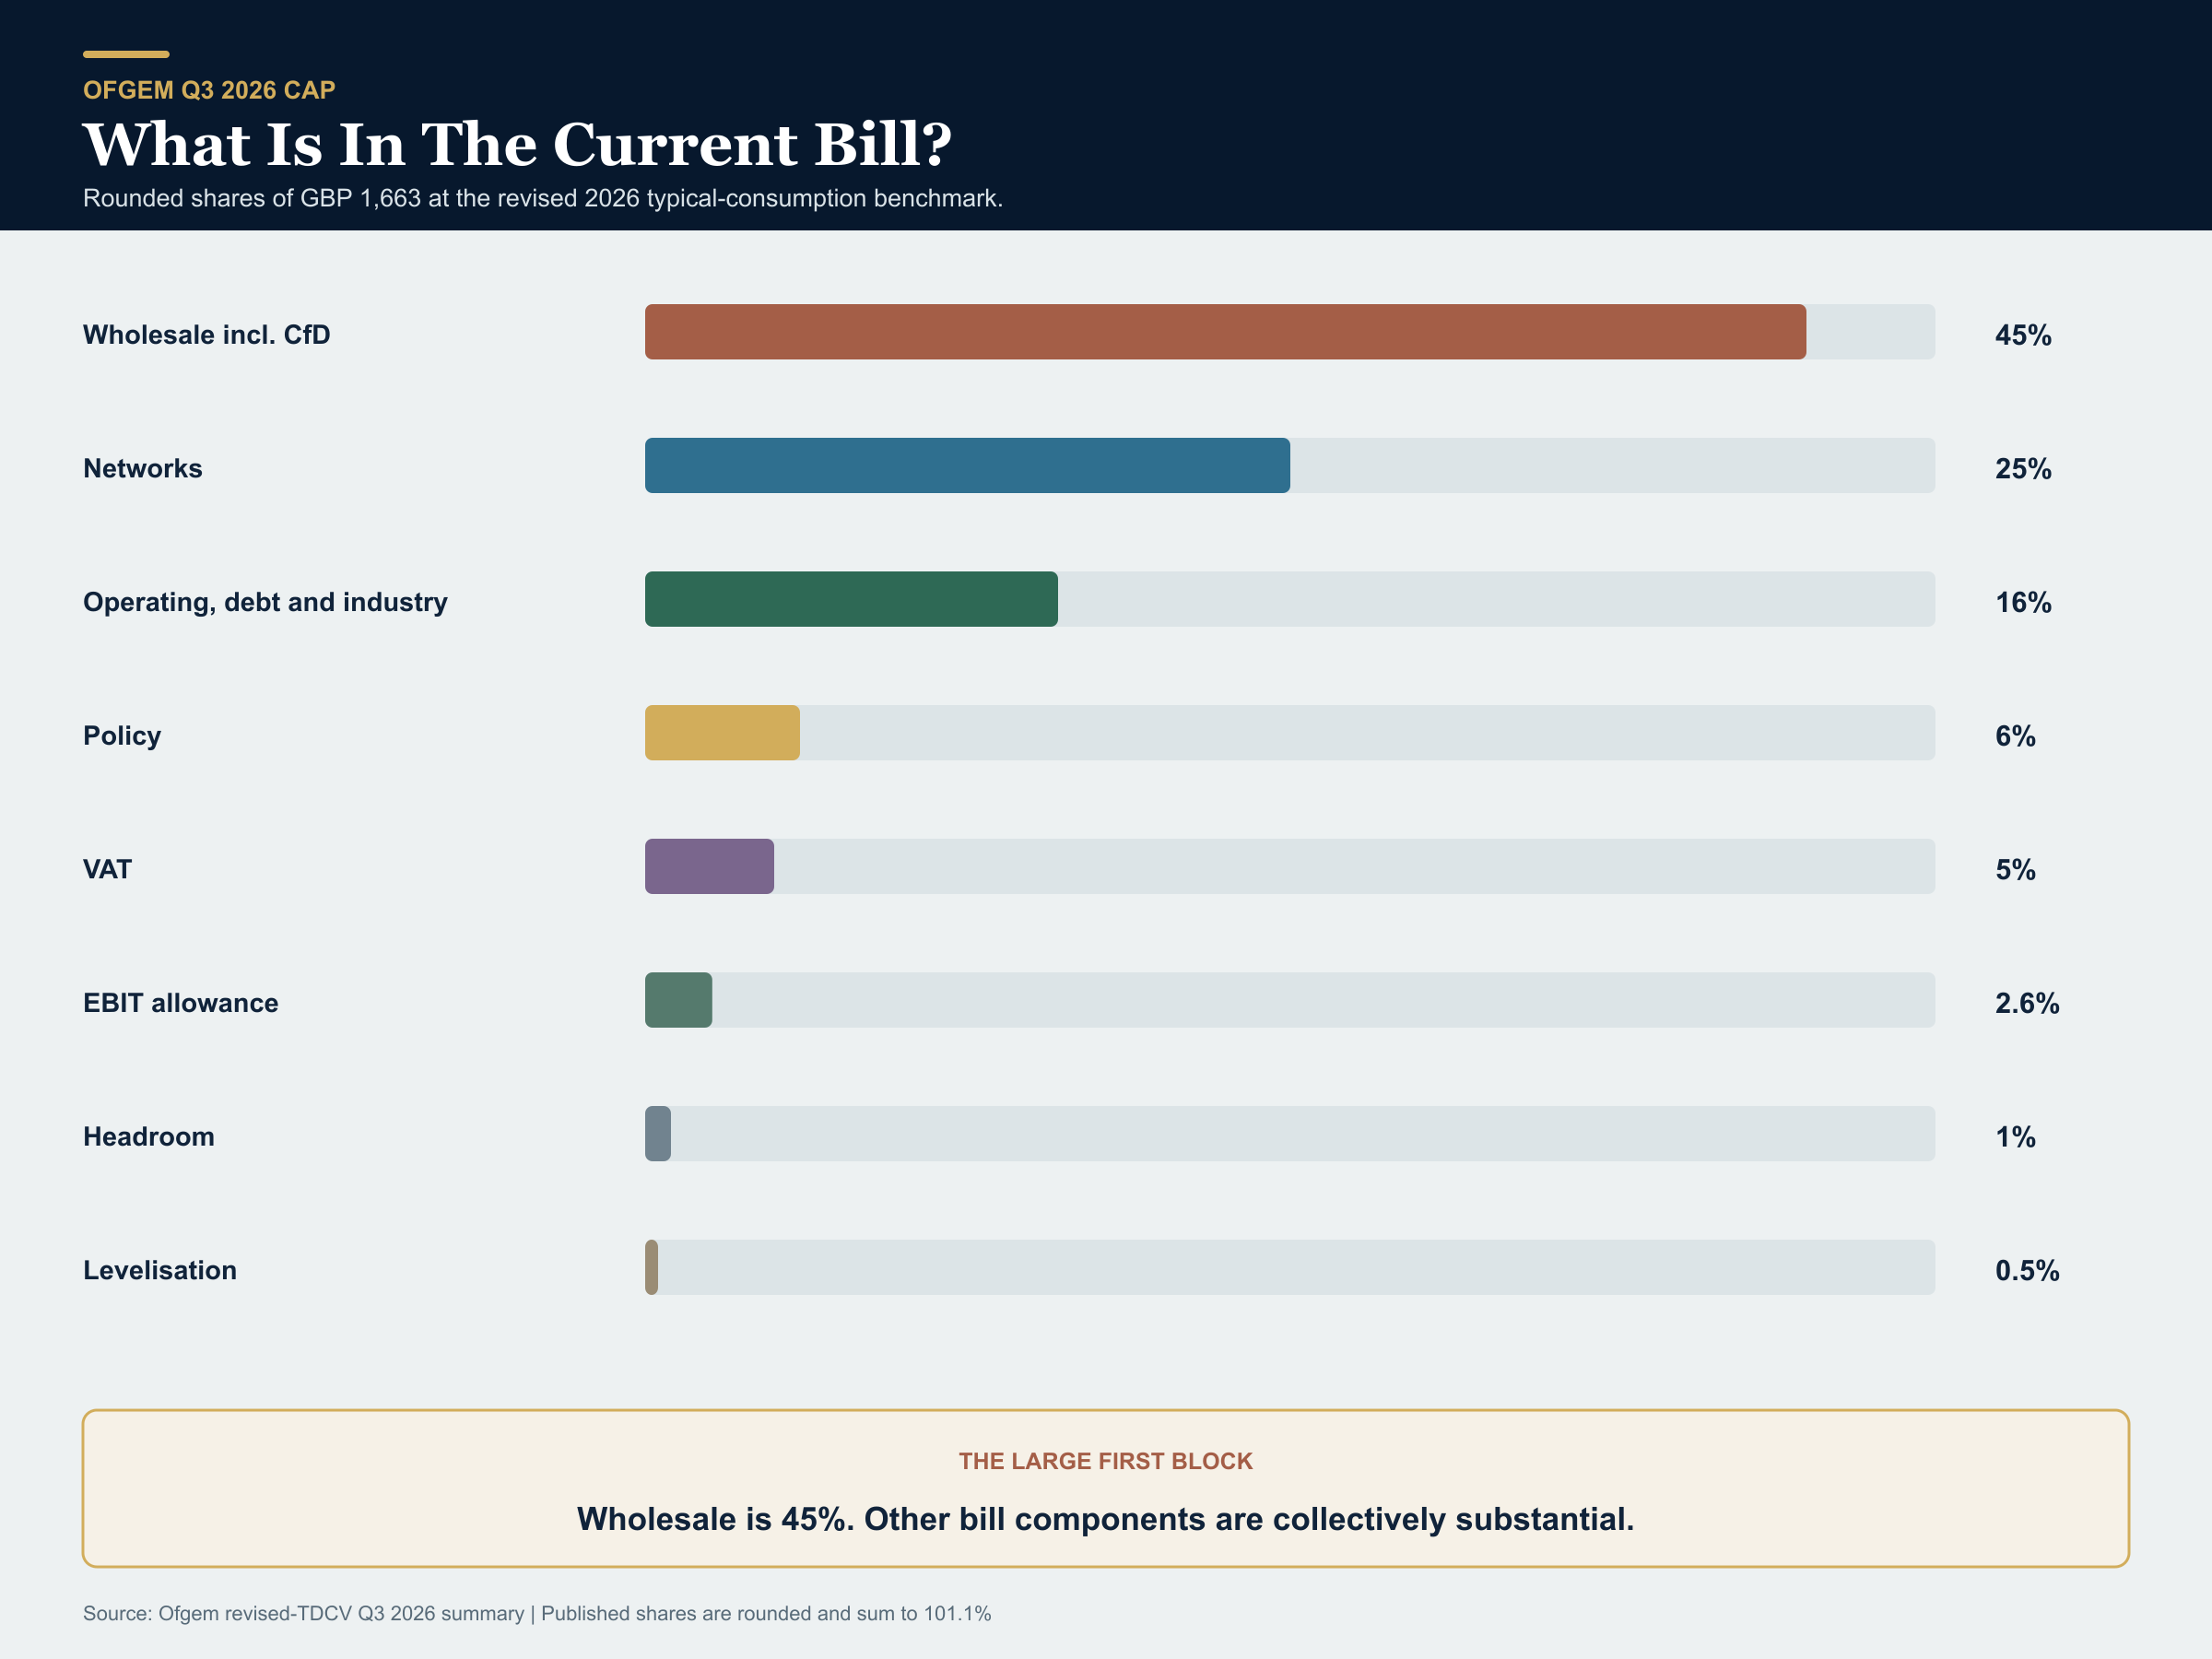
| Component | Share of £1,663 cap | What it includes or means |
|---|---|---|
| Wholesale, including Contracts for Difference | 45% | Gas and electricity purchases, hedging and CfD treatment. |
| Networks | 25% | Transmission, distribution and related allowed costs. |
| Operating, debt and industry costs | 16% | Supplier operations, debt allowances, metering and industry charges. |
| Policy | 6% | Remaining policy-cost allowances after the April 2026 changes. |
| VAT | 5% | Tax included in the July cap. The announced electricity VAT change was not yet enacted. |
| Supplier EBIT allowance | 2.6% | Regulated allowance, not the realised profit of every supplier. |
| Headroom | 1.0% | Allowance for uncertainty in efficiently incurred costs. |
| Levelisation | 0.5% | Adjustment supporting similar payment-method treatment. |
The source is Ofgem's revised-TDCV Q3 2026 cap summary. Its percentages are rounded and therefore add to slightly more than 100%.
There is another trap here. Ofgem changed its Typical Domestic Consumption Values from July 2026. The current presentation uses 2,500 kWh of electricity and 9,500 kWh of gas, producing the £1,663 benchmark above. Expressing the same rates at the previous 2,700 kWh and 11,500 kWh assumptions produces £1,862. The £199 difference is a denominator change, not a price-rate saving.
The cap limits unit rates and standing charges. It does not cap the total amount a household can spend. Use more energy and the bill is higher.
What the simple stories get right and wrong
| Claim | What it gets right | Where it overreaches | Verdict |
|---|---|---|---|
| It was all the global gas crisis. | Wholesale gas explains most of the 2022 surge and still strongly affects gas and electricity. | It does not explain every current network, balancing, debt, tax or operating cost. | Dominant first cause, incomplete current explanation |
| Net zero made bills high. | The transition requires networks, balancing, contracts and financing. Poor sequencing creates expensive constraints. | Direct policy costs were not the main 2022 driver. Renewables also reduce gas burn, and CfDs can return money when market prices are high. | Real cost channel, materially overstated as the single cause |
| Renewables make bills cheap. | Wind and solar have no fuel bill and can provide low-cost bulk energy. | A cheap plant is not a complete reliable system. Location, grid, reserve, storage and financing matter. | Supported only within a stated boundary |
| Retail-supplier profiteering explains the bill. | Individual companies can earn large profits and deserve scrutiny. | The regulated retail-supplier EBIT allowance is 2.6% of this cap. It does not measure generator, producer, trading or vertically integrated group profits. | Retail allowance is too small to explain the wholesale shock |
| More North Sea gas would make British gas cheap. | Production can improve security, tax receipts and import dependence. | Privately produced gas is sold into an interconnected market. No official evidence reviewed provides a robust £-per-bill counterfactual. | Security argument, not a guaranteed price argument |
| The charges were removed, so the cost disappeared. | Removing charges from a bill can make that bill lower. | When government funds the same obligation, taxpayers still carry the cost. | False accounting if the tax side is ignored |
Policy costs matter, but the ledger moved
From April 2026, government ended bill charges for the Energy Company Obligation and Great British Insulation Scheme, and funded 75% of domestic Renewables Obligation costs from the Exchequer for 2026/27 to 2028/29. It described the average household reduction as about £150 a year.
That was a real reduction in the bill. Part of it was a transfer to general taxation. The correct sentence is not "the cost vanished". It is "the incidence of the cost changed".
Government also announced that it intended to reduce VAT on qualifying domestic electricity in Great Britain from 5% to 0% from 1 October 2026, subject to a planned statutory instrument. It estimated about £45 off the annualised Ofgem cap. At this article's evidence date, the measure was not yet enacted, funding was stated for the remainder of 2026/27, and Northern Ireland required a separate arrangement. It was not included in the July-to-September figures above and applied to electricity rather than gas.
These decisions show why a household bill, a taxpayer cost and a total system cost must be kept separate.
Why is Britain more expensive than much of Europe?
The first correction is that Britain is not unusually expensive for every form of household energy. It is unusually expensive for electricity. Household gas tells almost the opposite story.
| Fuel | UK price | EU14 + UK median | UK position |
|---|---|---|---|
| Electricity | 29.78p/kWh | 23.62p/kWh | Fourth-highest of 15; 6.16p above the median |
| Gas | 7.05p/kWh | 10.81p/kWh | Lowest of 15; 3.76p below the median |
The tax boundary is revealing. Before tax, UK household electricity was 20.50p/kWh against a 19.08p median, about 7.4% higher. After taxes and levies were included, the UK price was about 26.1% above the median. That does not mean the whole international gap is a tax effect. Countries place environmental, social and network costs in different ledgers, and some use subsidies or regulated prices. It does show that where a country collects the money can materially change the visible bill.
The remainder reflects the system described above: Britain's exposure to gas, the cost of networks and balancing, supplier and debt allowances, and the way those costs are recovered. Countries with abundant domestic hydro, nuclear, gas or other low-cost supply can begin from a different position. Exchange rates, retail-market design, public subsidy and consumption patterns also affect the comparison. There is no honest single-cause explanation for every country's rank.
What does the wider world comparison show?
There is no complete, like-for-like world league table. The latest wider official benchmark available at this article's evidence date is DESNZ's 2024 comparison using IEA data. It converts annual household end-user prices to sterling using annual average exchange rates and includes non-refundable taxes. The table below shows selected reporting countries, not the entire world.
| Country or benchmark | Electricity | Gas |
|---|---|---|
| Germany | 33.46p/kWh | 10.98p/kWh |
| United Kingdom | 30.45p/kWh | 7.44p/kWh |
| Italy | 30.26p/kWh | 12.42p/kWh |
| France | 23.73p/kWh | 11.04p/kWh |
| IEA reporting-country median | 20.89p/kWh | 9.90p/kWh |
| Japan | 16.46p/kWh | Not reported |
| United States | 12.86p/kWh | 3.75p/kWh |
| Canada | 10.32p/kWh | 2.32p/kWh |
| Turkey | 4.24p/kWh | 1.77p/kWh |
Across the full reporting set, UK household electricity was the second-highest of 27 countries and about 45.8% above the median. UK household gas was the ninth-lowest of 24 and about 24.9% below the median. North American prices were much lower in this cash-price comparison, but the table does not adjust for household income, home efficiency, climate or how much energy each household uses. Nor does a low tariff prove that the underlying system is unsubsidised.
Britain's international price problem is therefore principally an electricity problem, not evidence that every British unit of energy is uniquely expensive.
So what would lower bills durably?
- Reduce the frequency with which expensive gas sets electricity prices. That requires more low-fuel-cost generation, but also storage, flexible demand, interconnection and firm capacity.
- Build networks before congestion becomes routine. Transmission spending is visible. Repeatedly paying to constrain generation because the wires are late is visible too.
- Make the retail market resilient. Thinly capitalised suppliers can appear competitive until the system socialises their failure.
- Deal with debt as an affordability problem. Allowing debt to compound leaves families worse off and adds costs to other bills.
- Insulate homes and reduce wasted heat. The cheapest unit during a price shock is still the unit a household does not need to buy.
- Publish every ledger. Show the household bill, tax-funded support, network investment, balancing, financing and legacy liabilities separately.
There is no cost-free route.
Staying dependent on gas exposes households to global commodity shocks. Building a lower-gas system requires capital, grid construction and competent sequencing. Producing more domestic gas can improve resilience but does not guarantee a domestic discount. Moving levies to taxation changes who pays and how visibly.
The honest policy test is not whether a proposal has a cost. It is whether the total cost, risk and service are better than the alternatives.
The answer I would carry forward
UK household energy bills remain above pre-crisis levels. The gas shock changed the market from which Britain buys heat and power, while inflation and other documented system costs help explain why the old price did not simply return. The available evidence does not apportion the entire gap among those causes.
The energy transition is part of the bill, but it cuts both ways. It adds networks, financing and balancing. It also reduces fuel purchases and exposure to a volatile commodity.
So this is not a story in which fossil fuels are free and net zero is expensive. Nor is it a story in which every new wind farm automatically makes the complete system cheap.
It is a systems problem.
We need to reduce Britain's exposure to the gas price while measuring and controlling the cost of the infrastructure built to replace it. Anything simpler may make a good sound bite. It does not make a good energy system.
Compared with Europe and the wider IEA group, the uncomfortable conclusion is specific rather than tribal: UK household electricity is exceptionally expensive, while UK household gas is comparatively cheap. The reasons sit across fuel exposure, infrastructure, market design and the choice to recover costs through the bill. Lowering electricity prices therefore requires more than waiting for wholesale gas to fall. It requires changing the structure that turns fuel, networks, policy and risk into the final pence per kilowatt-hour.
Related reading
- What Does Electricity Really Cost In The UK?
- Renewable Energy Is Not Material-Free
- UK Data Centre Water And Power: The Facts
Sources and notes
- DESNZ annual domestic energy bills for the fixed-consumption history.
- DESNZ Quarterly Energy Prices, June 2026 for 2025/26 household prices and methodology.
- DESNZ international domestic energy prices for the July-to-December 2025 European comparison and the underlying IEA annual tables.
- DESNZ Quarterly Energy Prices, September 2025 for the 2024 IEA household-price ranking and comparison method.
- Ofgem revised-TDCV Q3 2026 price-cap summary for the current £1,663 benchmark and cost shares.
- Ofgem Q3 2026 old-TDCV summary for the comparison with the previous consumption benchmark.
- Ofgem's wholesale-cost explanation for gas imports, marginal pricing and the relationship between gas and electricity.
- House of Commons BEIS Committee report for the April 2022 cap decomposition.
- National Audit Office supplier-market report for supplier failures and regulatory resilience.
- IEA Gas Market Report Q1 2026 for the restructuring of European gas supply.
- NESO Annual Balancing Costs Report 2025 for balancing and thermal-constraint costs.
- Ofgem's debt strategy update for household debt and the debt allowance.
- DESNZ ministerial direction for the April 2026 RO, ECO and GBIS changes and the RO funding period.
- Treasury written statement on electricity VAT for the intended October 2026 change, planned statutory instrument, stated funding period and Northern Ireland boundary. The £45 effect is a government estimate, not an independent outturn evaluation.
Figures have different geographies, periods and accounting boundaries. The article does not add annual balancing costs, multi-year network investment, household debt and price-cap components into one false total. This is public information and commentary, not financial or energy-tariff advice.