I have been trying to understand something that sounds simple.
If a wind turbine needs hundreds of tonnes of concrete and steel, and a solar farm needs glass, aluminium, copper, silicon, transport, maintenance and eventually replacement, in what sense is it renewable?
The precise answer is this:
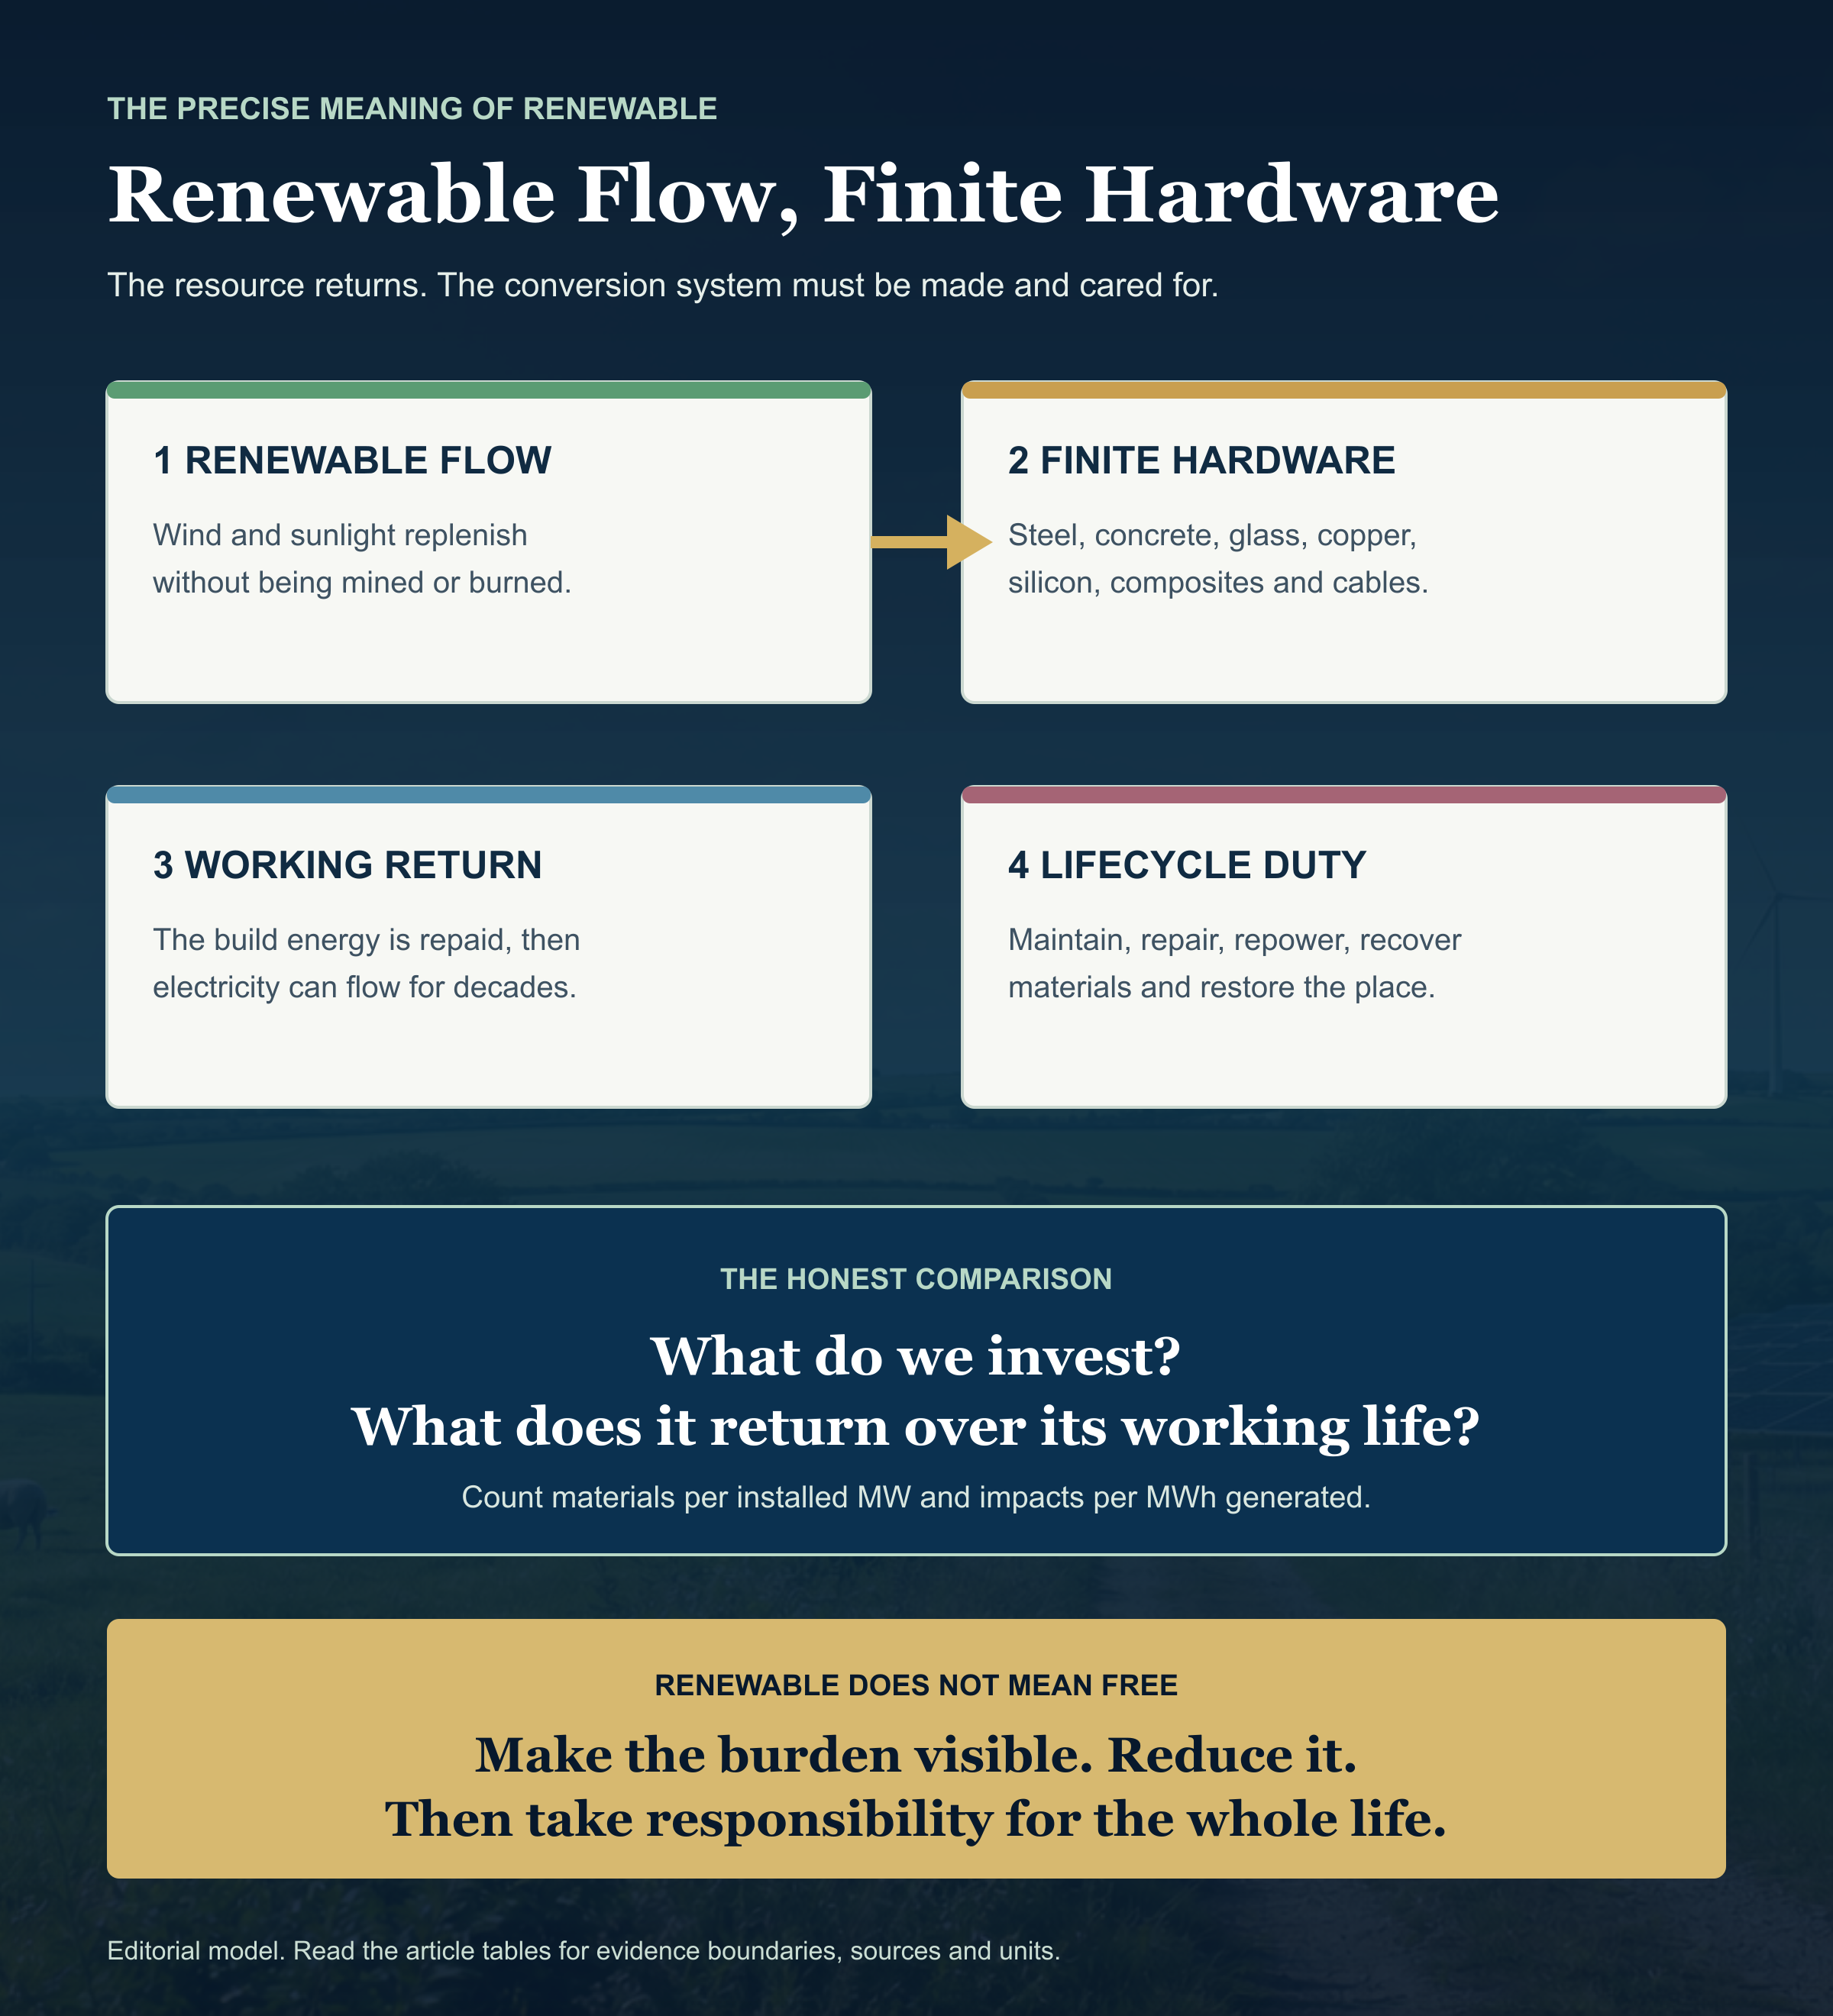
The wind and the sunlight are renewable. The machines that turn them into electricity are not.
That does not make wind and solar a fraud. It does mean that "renewable" should never be allowed to become shorthand for "material-free", "impact-free" or "permanent".
They are manufactured energy systems. We mine for them. We build them. We maintain them. We use land and sea for them. Then, after decades of operation, we have to repower, recycle, reuse or dispose of them.
The useful question is not whether they consume anything. Of course they do.
It is: what do they consume, how long do they work, and how much electricity do they return for that physical investment?
Three technologies, two ways of counting
To keep the comparison honest, I have limited this article to three broad classes:
- UK onshore wind;
- UK offshore wind; and
- ground-mounted, utility-scale crystalline-silicon solar PV.
I use two different measures because they answer different questions.
- Per installed megawatt tells us about the physical infrastructure we build.
- Per megawatt hour generated tells us what that infrastructure returns over its working life.
Those measures must not be muddled. One megawatt of offshore wind and one megawatt of British solar do not produce the same amount of electricity in a year. A foundation figure from one manufacturer is not a universal description of every project. A module-only solar inventory is not the same boundary as a complete wind plant including foundations.
This is plant-level lifecycle evidence, not a whole-grid comparison. Additional storage, wider transmission expansion, balancing, reserve and system curtailment are outside this article's numerical scope. Some plant case studies do include their own connection, array or export assets.
So every number below carries its year, geography, unit and boundary.
Derived annual output under DESNZ fleet assumptions
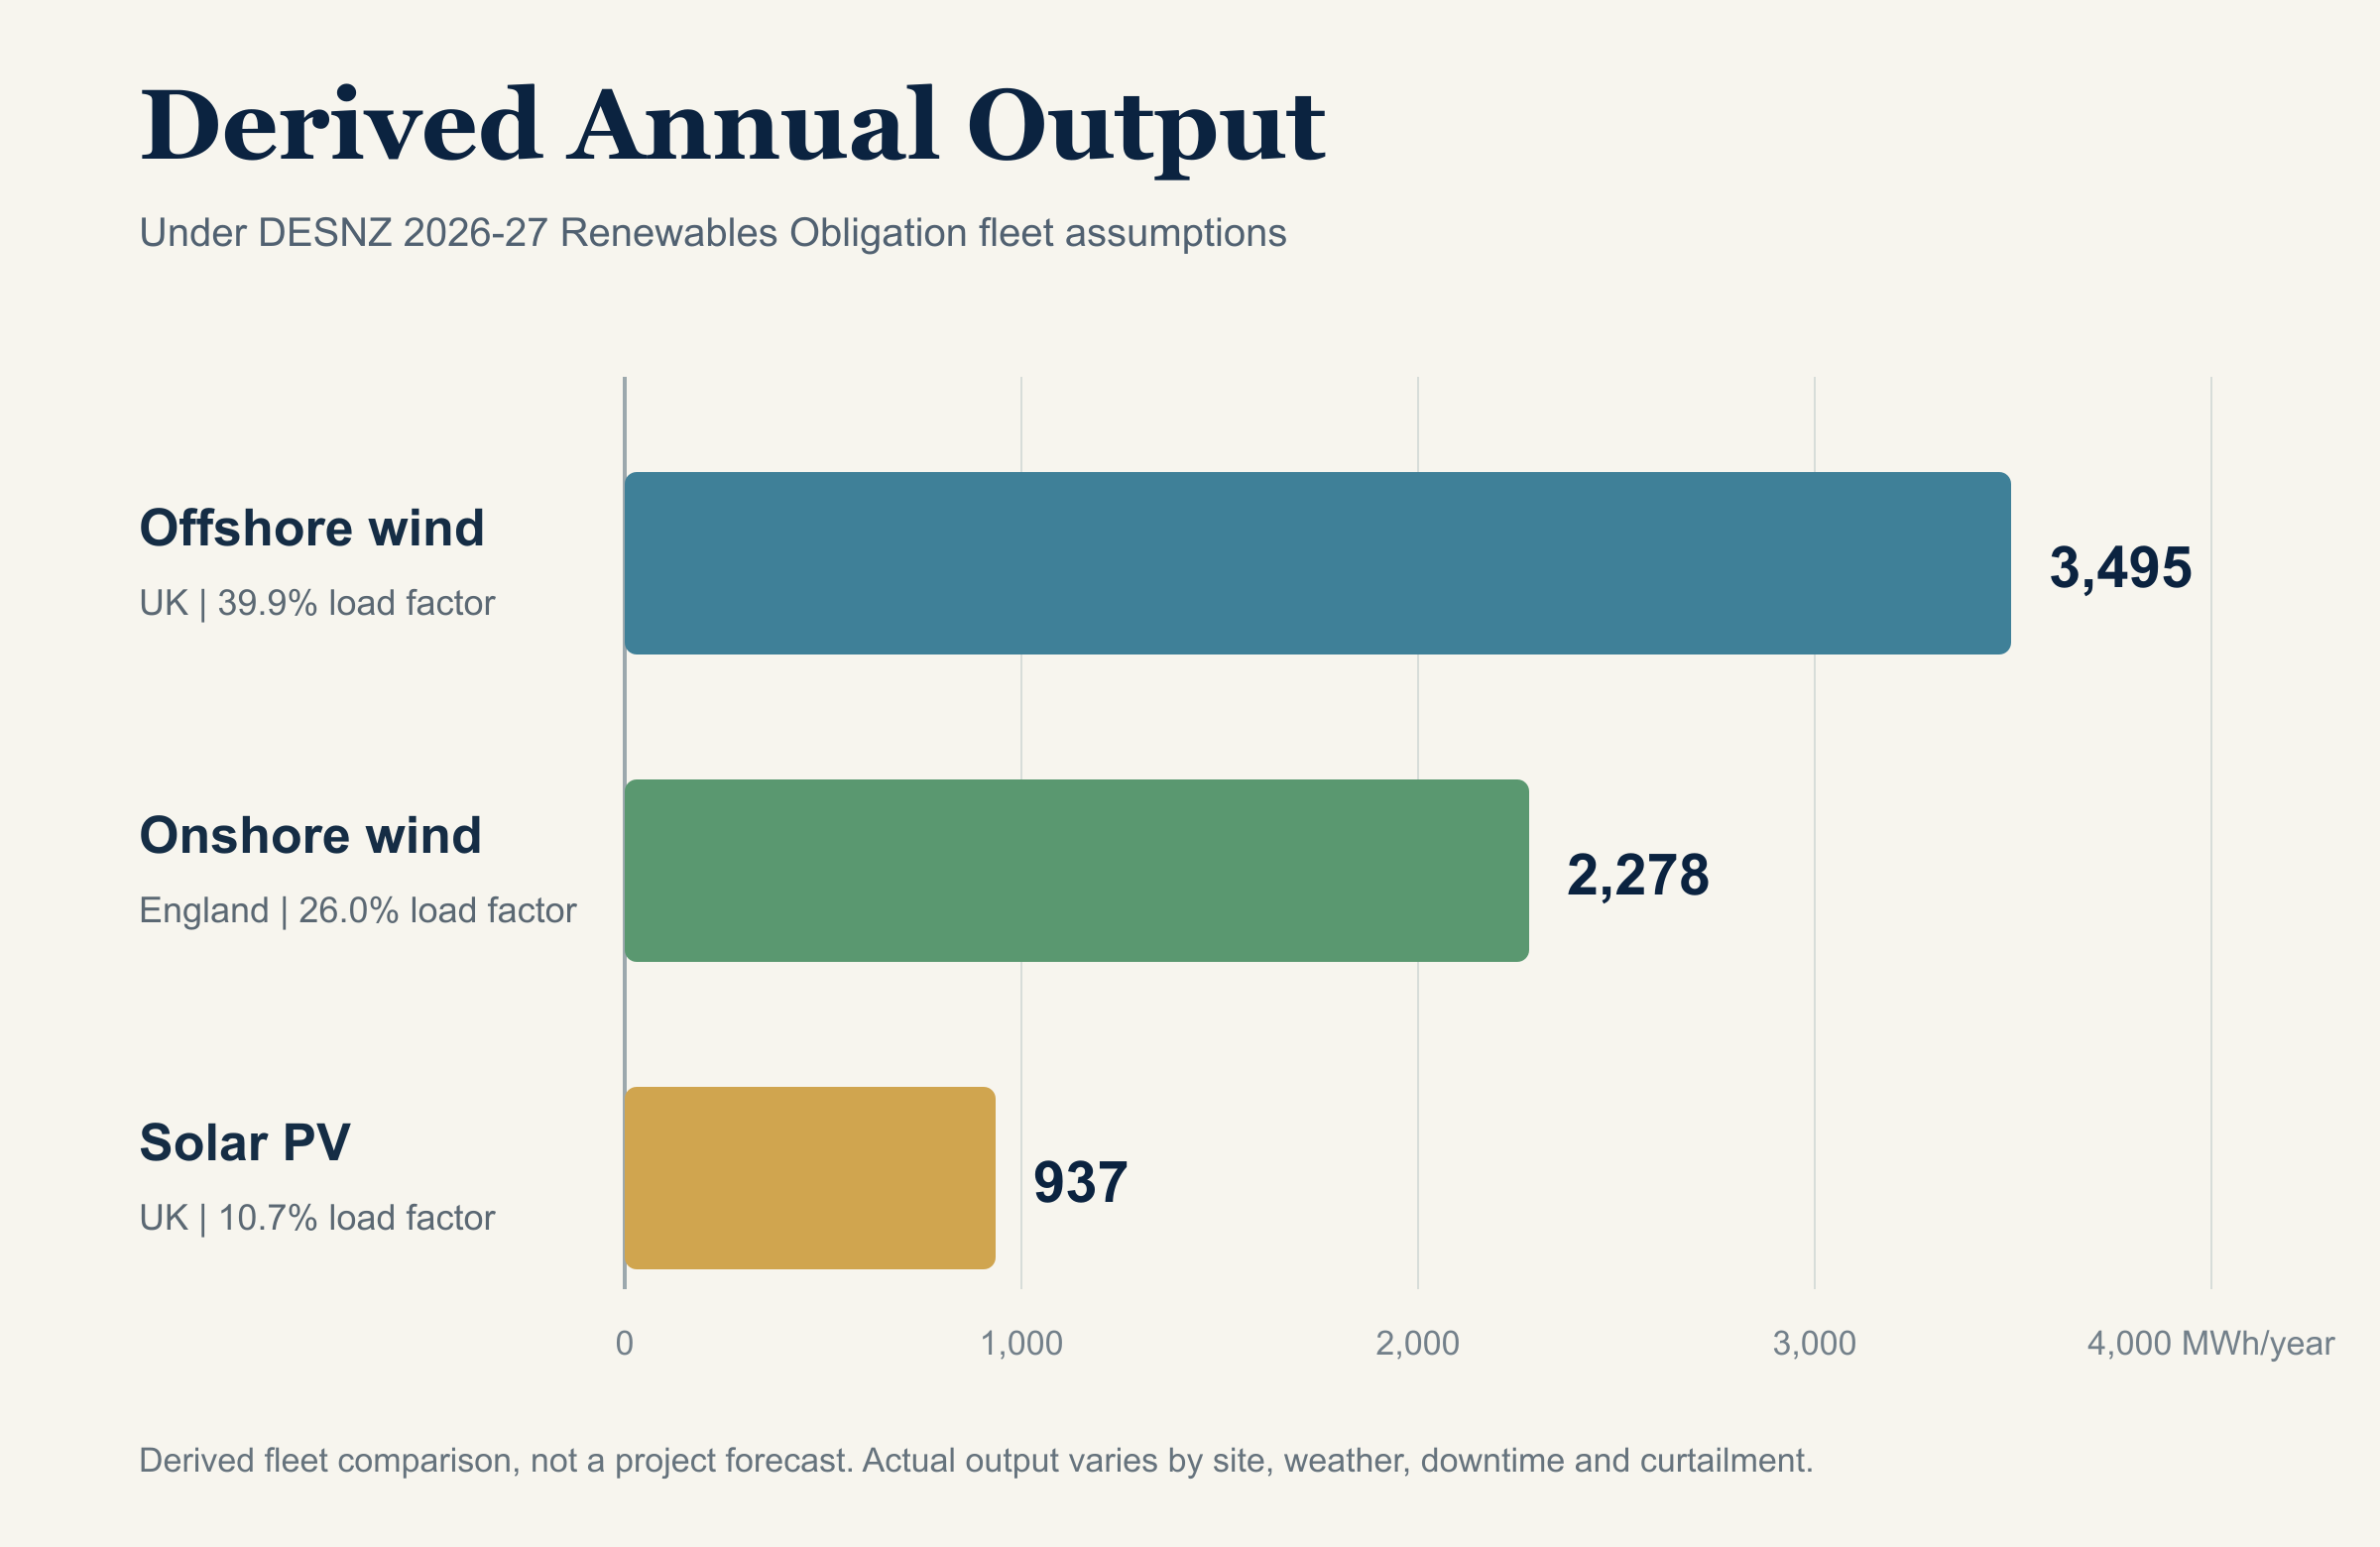
The Department for Energy Security and Net Zero uses historic load factors to estimate output from Renewables Obligation-accredited stations whose configuration has not changed. Its 2026 to 2027 calculation uses 26.0% for English onshore wind, 39.9% for UK offshore wind and 10.7% for UK solar PV. These are fleet assumptions on a total-installed-capacity basis, net of availability. They are not forecasts for a new project.
Applied to the 8,760 hours in a normal year, one installed megawatt would produce approximately:
| Technology | Load factor | Derived annual output | Source period and boundary | Status |
|---|---|---|---|---|
| Onshore wind | 26.0% | 2,278 MWh | England; capacity-weighted actual generation, April 2017 to March 2025 | Derived |
| Offshore wind | 39.9% | 3,495 MWh | UK; capacity-weighted actual generation with wind-speed correction, April 2015 to March 2025 | Derived |
| Solar PV | 10.7% | 937 MWh | UK; capacity-weighted actual generation, April 2017 to March 2025 | Derived |
That is our first important result. Offshore wind generally needs more difficult infrastructure, but the same installed megawatt also produces substantially more electricity in current UK conditions.
This is why a materials-per-MW table is useful but incomplete. The output over time matters.
How quickly is the build energy repaid?
Energy payback time asks how long a system must operate before it has generated the amount of energy used across its manufacture, transport, construction, operation and end-of-life boundary.
It is not the same as financial payback. It is also sensitive to location, technology, supply-chain electricity and the lifecycle method used.
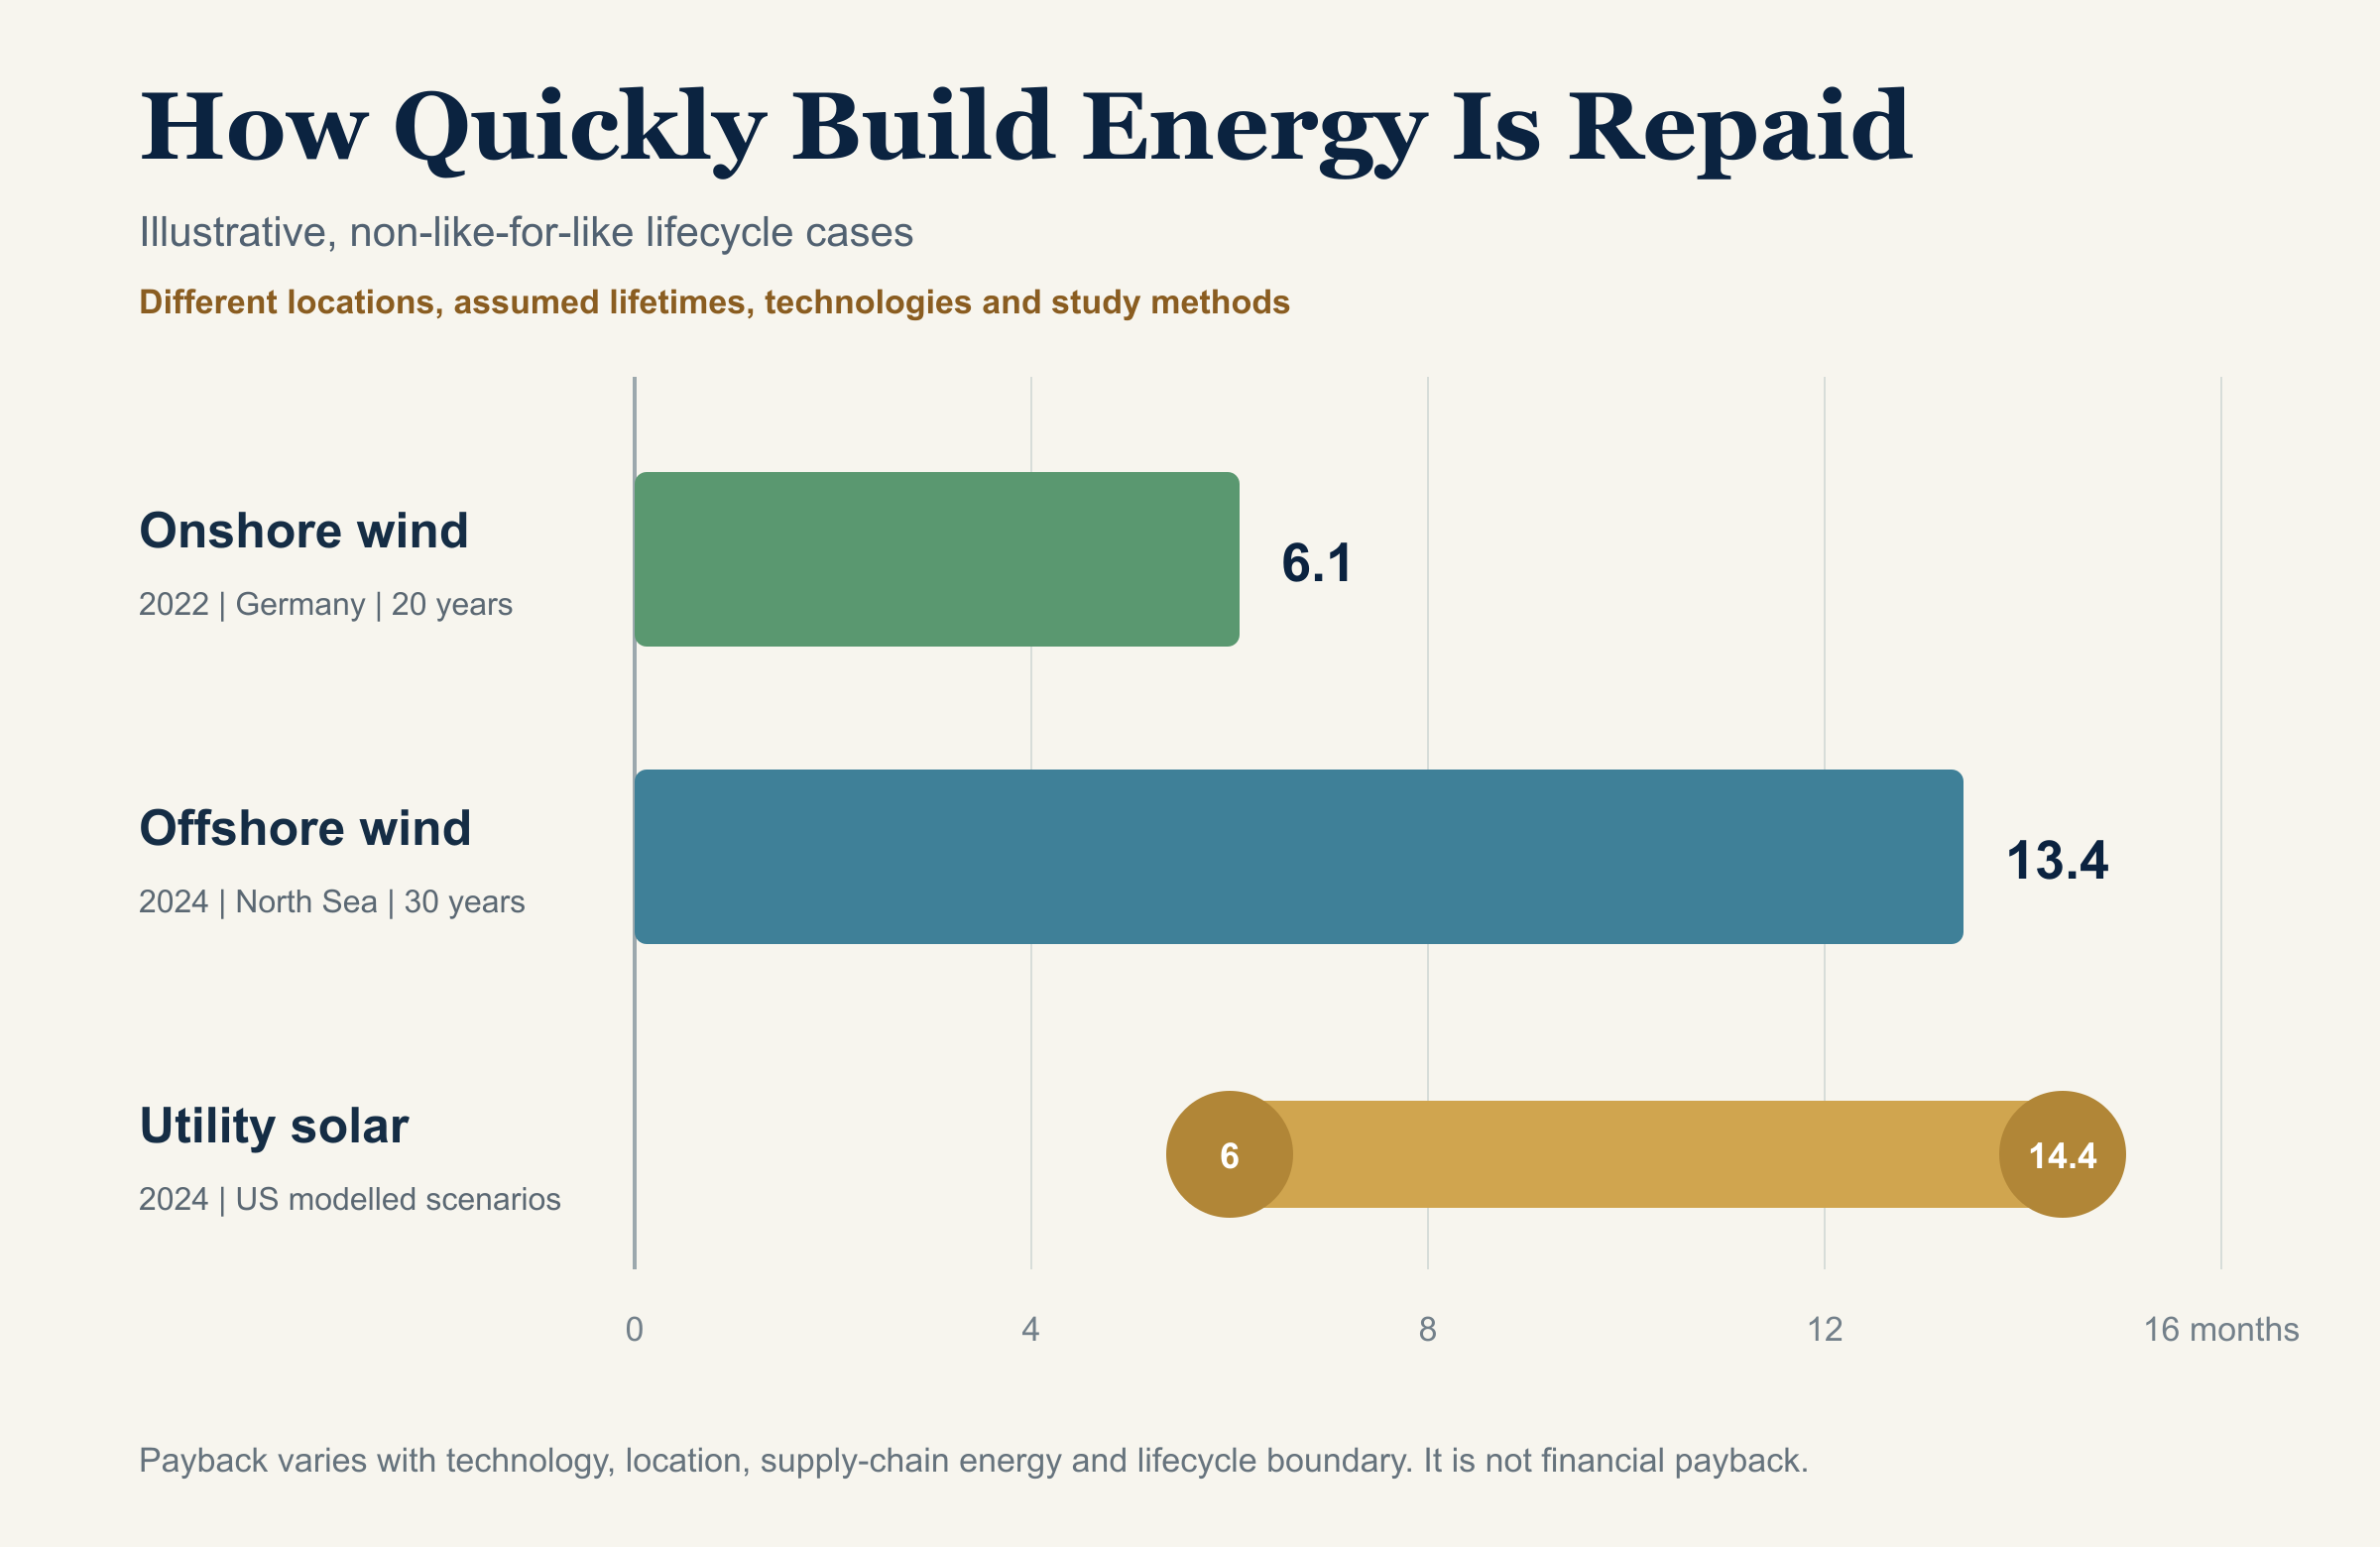
The following cases are illustrative and not like-for-like. They use different locations, wind classes, assumed lifetimes, technologies and study methods. The Vestas studies are vendor-authored lifecycle assessments with external critical review; those reviews did not independently verify every underlying dataset or model.
| Technology | Energy payback | Evidence | Boundary and status |
|---|---|---|---|
| Onshore wind | 6.1 months | Vestas V136-4.2 MW plant LCA, 2022 | Germany; 100 MW medium-wind plant; 20-year assumed life; externally reviewed vendor case |
| Offshore wind | 13.4 months | Vestas V236-15 MW plant LCA, 2024 | North Sea; 990 MW high-wind plant; 30-year assumed life; includes array and export assets; externally reviewed vendor case |
| Utility-scale silicon solar | 0.5 to 1.2 years | NREL utility-scale PV LCA, 2024 | United States lifecycle scenarios; modelled range |
The striking point is not that the construction energy is zero. It plainly is not. It is that, in these studies, the systems repay that energy during roughly their first year and then continue producing for decades.
A wind turbine has an expected service life of around 30 years, according to the US Department of Energy's end-of-service guide. Blades, gearboxes, generators and smaller hardware may need earlier repair or replacement. Solar systems are commonly modelled over 25 to 30 years, while inverters may need repair or replacement within that period.
That long operating return is the reason the materials burden and the renewable label can both be true at once.
What one megawatt is made from
There is no universal bill of materials. Turbine drivetrain, tower height, foundation, water depth, export cable, solar module, mounting structure and ground conditions all change it.
The European Commission's Joint Research Centre therefore publishes ranges for wind rather than one magic number. Its 2024 synthesis draws on earlier JRC work and recent industrial lifecycle assessments, predominantly Vestas studies. Including turbines and foundations, it reports approximately 300 to 500 tonnes of concrete and 90 to 130 tonnes of steel per installed MW. Copper ranges from 0.65 to 6.2 tonnes per MW because generator designs differ. Glass and carbon composites sit around 6 to 9 tonnes, and polymers around 3.9 to 5.5 tonnes. Depending on the material, the published bounds represent uncertainty or interquartile ranges, not universal minima and maxima.
Rare earths need careful language. Not every wind turbine requires the same permanent magnets. JRC finds neodymium intensity ranging from 6 to 210 kg per MW and dysprosium from 1 to 21 kg per MW, depending heavily on the generator technology. Saying "wind turbines use rare earths" is true for some designs and seriously incomplete for others.
Solar is a different machine. The dominant bulk materials are glass, steel and aluminium, with copper for electrical connections and concrete where the mounting system requires it. The active cell also depends on highly processed silicon and small but important quantities of silver. The JRC's 2020 scenarios show how strongly those requirements can change as module efficiency, wafer thickness, silver use and mounting systems evolve.
The IEA PVPS published a major photovoltaic lifecycle inventory update in July 2026. It is better current evidence than simply repeating a decade-old module recipe. It also warns us not to treat every dataset as interchangeable: its silicon manufacturing data are largely from 2022 to 2025, while some balance-of-system datasets are older, and manufacturer, measured and modelled inventories have different uses.
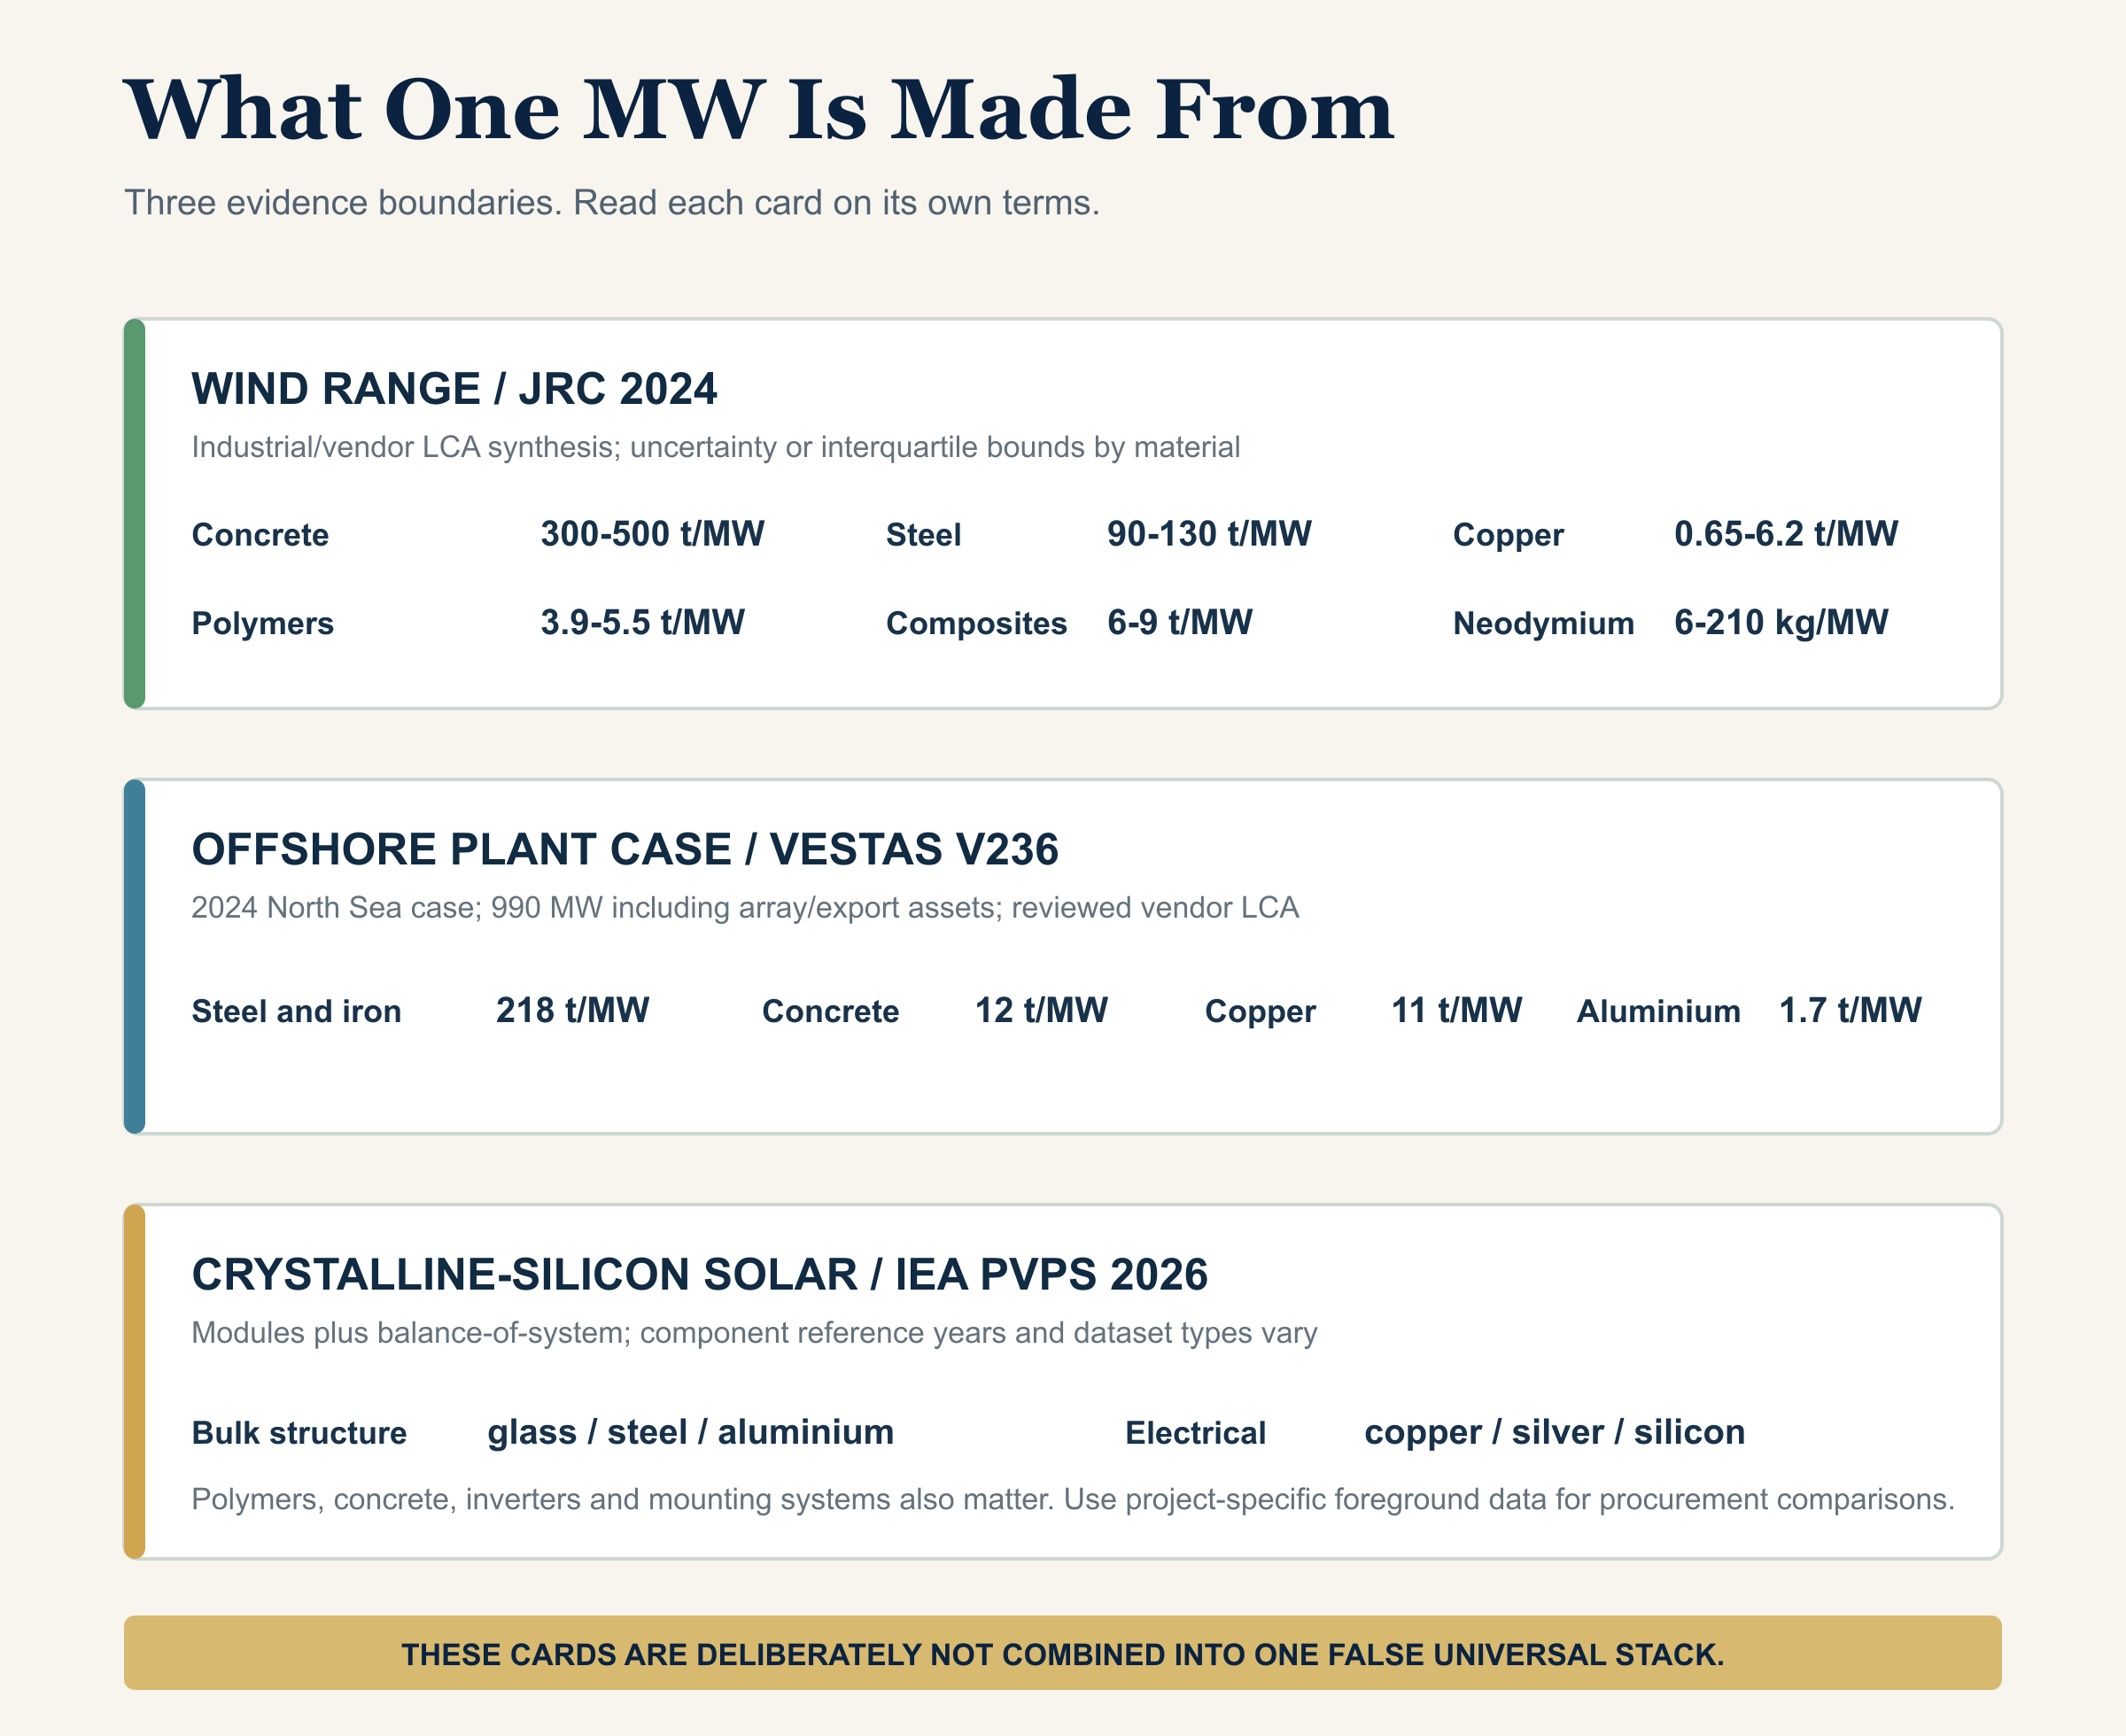
| Technology evidence | Material figures | Year and geography | Boundary | Status |
|---|---|---|---|---|
| Wind, JRC range | Concrete 300-500 t; steel 90-130 t; copper 0.65-6.2 t; polymers 3.9-5.5 t; composites 6-9 t per MW | JRC synthesis drawing on industrial/vendor LCAs, 2024 | Turbines and foundations; multiple current drivetrain types | Uncertainty or interquartile bounds, depending on material |
| Onshore wind plant example | About 357 t concrete; 141 t steel and iron; 1.3 t copper; 3.2 t aluminium per MW | Vestas V136 German plant case, 2022 | Whole-plant material inventory divided by 100 MW rated capacity | Derived from externally reviewed vendor LCA |
| Offshore wind plant example | About 218 t steel and iron; 12 t concrete; 11 t copper; 1.7 t aluminium per MW | Vestas V236 North Sea plant case, 2024 | Whole-plant material inventory divided by 990 MW rated capacity; includes array and export assets | Derived from externally reviewed vendor LCA |
| Crystalline-silicon solar | Bulk demand led by glass, steel and aluminium; copper, silicon, silver, polymers and concrete also matter | IEA PVPS update, 2026; JRC scenarios, 2020 | Modules plus balance-of-system; reference years vary by component | Mixed measured, modelled and retained inventory data |
I have deliberately not drawn one seductive stacked bar that pretends all four rows have the same lifecycle boundary. They do not.
The honest conclusion is simpler: renewable electricity moves part of our resource burden away from continuously buying and burning fuel and towards building a large stock of long-lived physical equipment.
Land is not one number either
Onshore wind uses a wide project envelope because turbines must be spaced apart. But the directly disturbed land around foundations, roads and substations is much smaller, and farming can often continue between turbines.
Ground-mounted solar occupies land more continuously. That can create a clearer competition with other uses, especially where projects are poorly located. But it is not automatically the end of agriculture. Grazing, pollinator habitat and some crops can share a site through agrivoltaic design. The US Department of Energy describes this as an active field of research, not a universal promise.
England's 2026 Land Use Framework gives a simple trend-based extrapolation of 155,000 hectares for renewables by 2050, about 1% of England's land and 2% of utilised agricultural area. It is not a policy allocation or detailed scenario. The framework says some of that land will continue to produce food and stresses that the estimate is uncertain.
That is the right kind of honesty. We should not divide food and electricity by some invented common unit and declare a winner. We should ask what land is being changed, how productive it is, what else can happen there, what habitats are affected and whether a better site exists.
Offshore wind moves much of the physical footprint to the sea, but it does not make the footprint disappear. Foundations, cables, ports, seabed disturbance, maintenance vessels, fisheries, marine ecology and onshore grid connections all remain part of the system.
What happens after twenty-five or thirty years?
Most of a wind turbine's mass is made from familiar recyclable metals. The US Department of Energy says 85% to 90% of turbine mass, excluding foundations, wiring and wider project infrastructure, is made from materials classed as easily recyclable. That describes the material composition, not an achieved recycling rate.
The difficult bit is the composite material in blades and covers. Those components represent a much smaller share of mass, but they were designed to be strong, light and durable, which is precisely what makes them awkward to separate. Mechanical recycling, thermal recovery, cement-kiln use and blade repurposing exist, but availability and economics vary. As of the guide's 2022 evidence, landfill remained the common US route for many retired blades.
Foundations create another choice. Full removal causes disturbance; partial removal leaves material underground. That should be decided and funded before construction, not improvised after the owner has disappeared.
Solar has its own end-of-life tension. Frames, wiring and glass can be recovered, but a high theoretical recovery rate is not the same as a working local recycling market. The useful policy question is not "can this be recycled?" It is "will it be collected, processed and returned to a valuable use at scale?"
Decommissioning plans, financial assurance, component traceability and design for disassembly are part of the energy system, not an optional afterthought.
The emissions comparison still matters
Calling out material use does not erase the lifecycle emissions difference between technologies.
The UNECE's final 2022 lifecycle assessment and corrigendum put unabated hard coal, natural-gas combined cycle without carbon capture, nuclear, solar and wind on one harmonised global modelling basis. It is not a forecast of a particular British project, but it is useful context because it avoids mixing one study's factory boundary with another study's complete system.
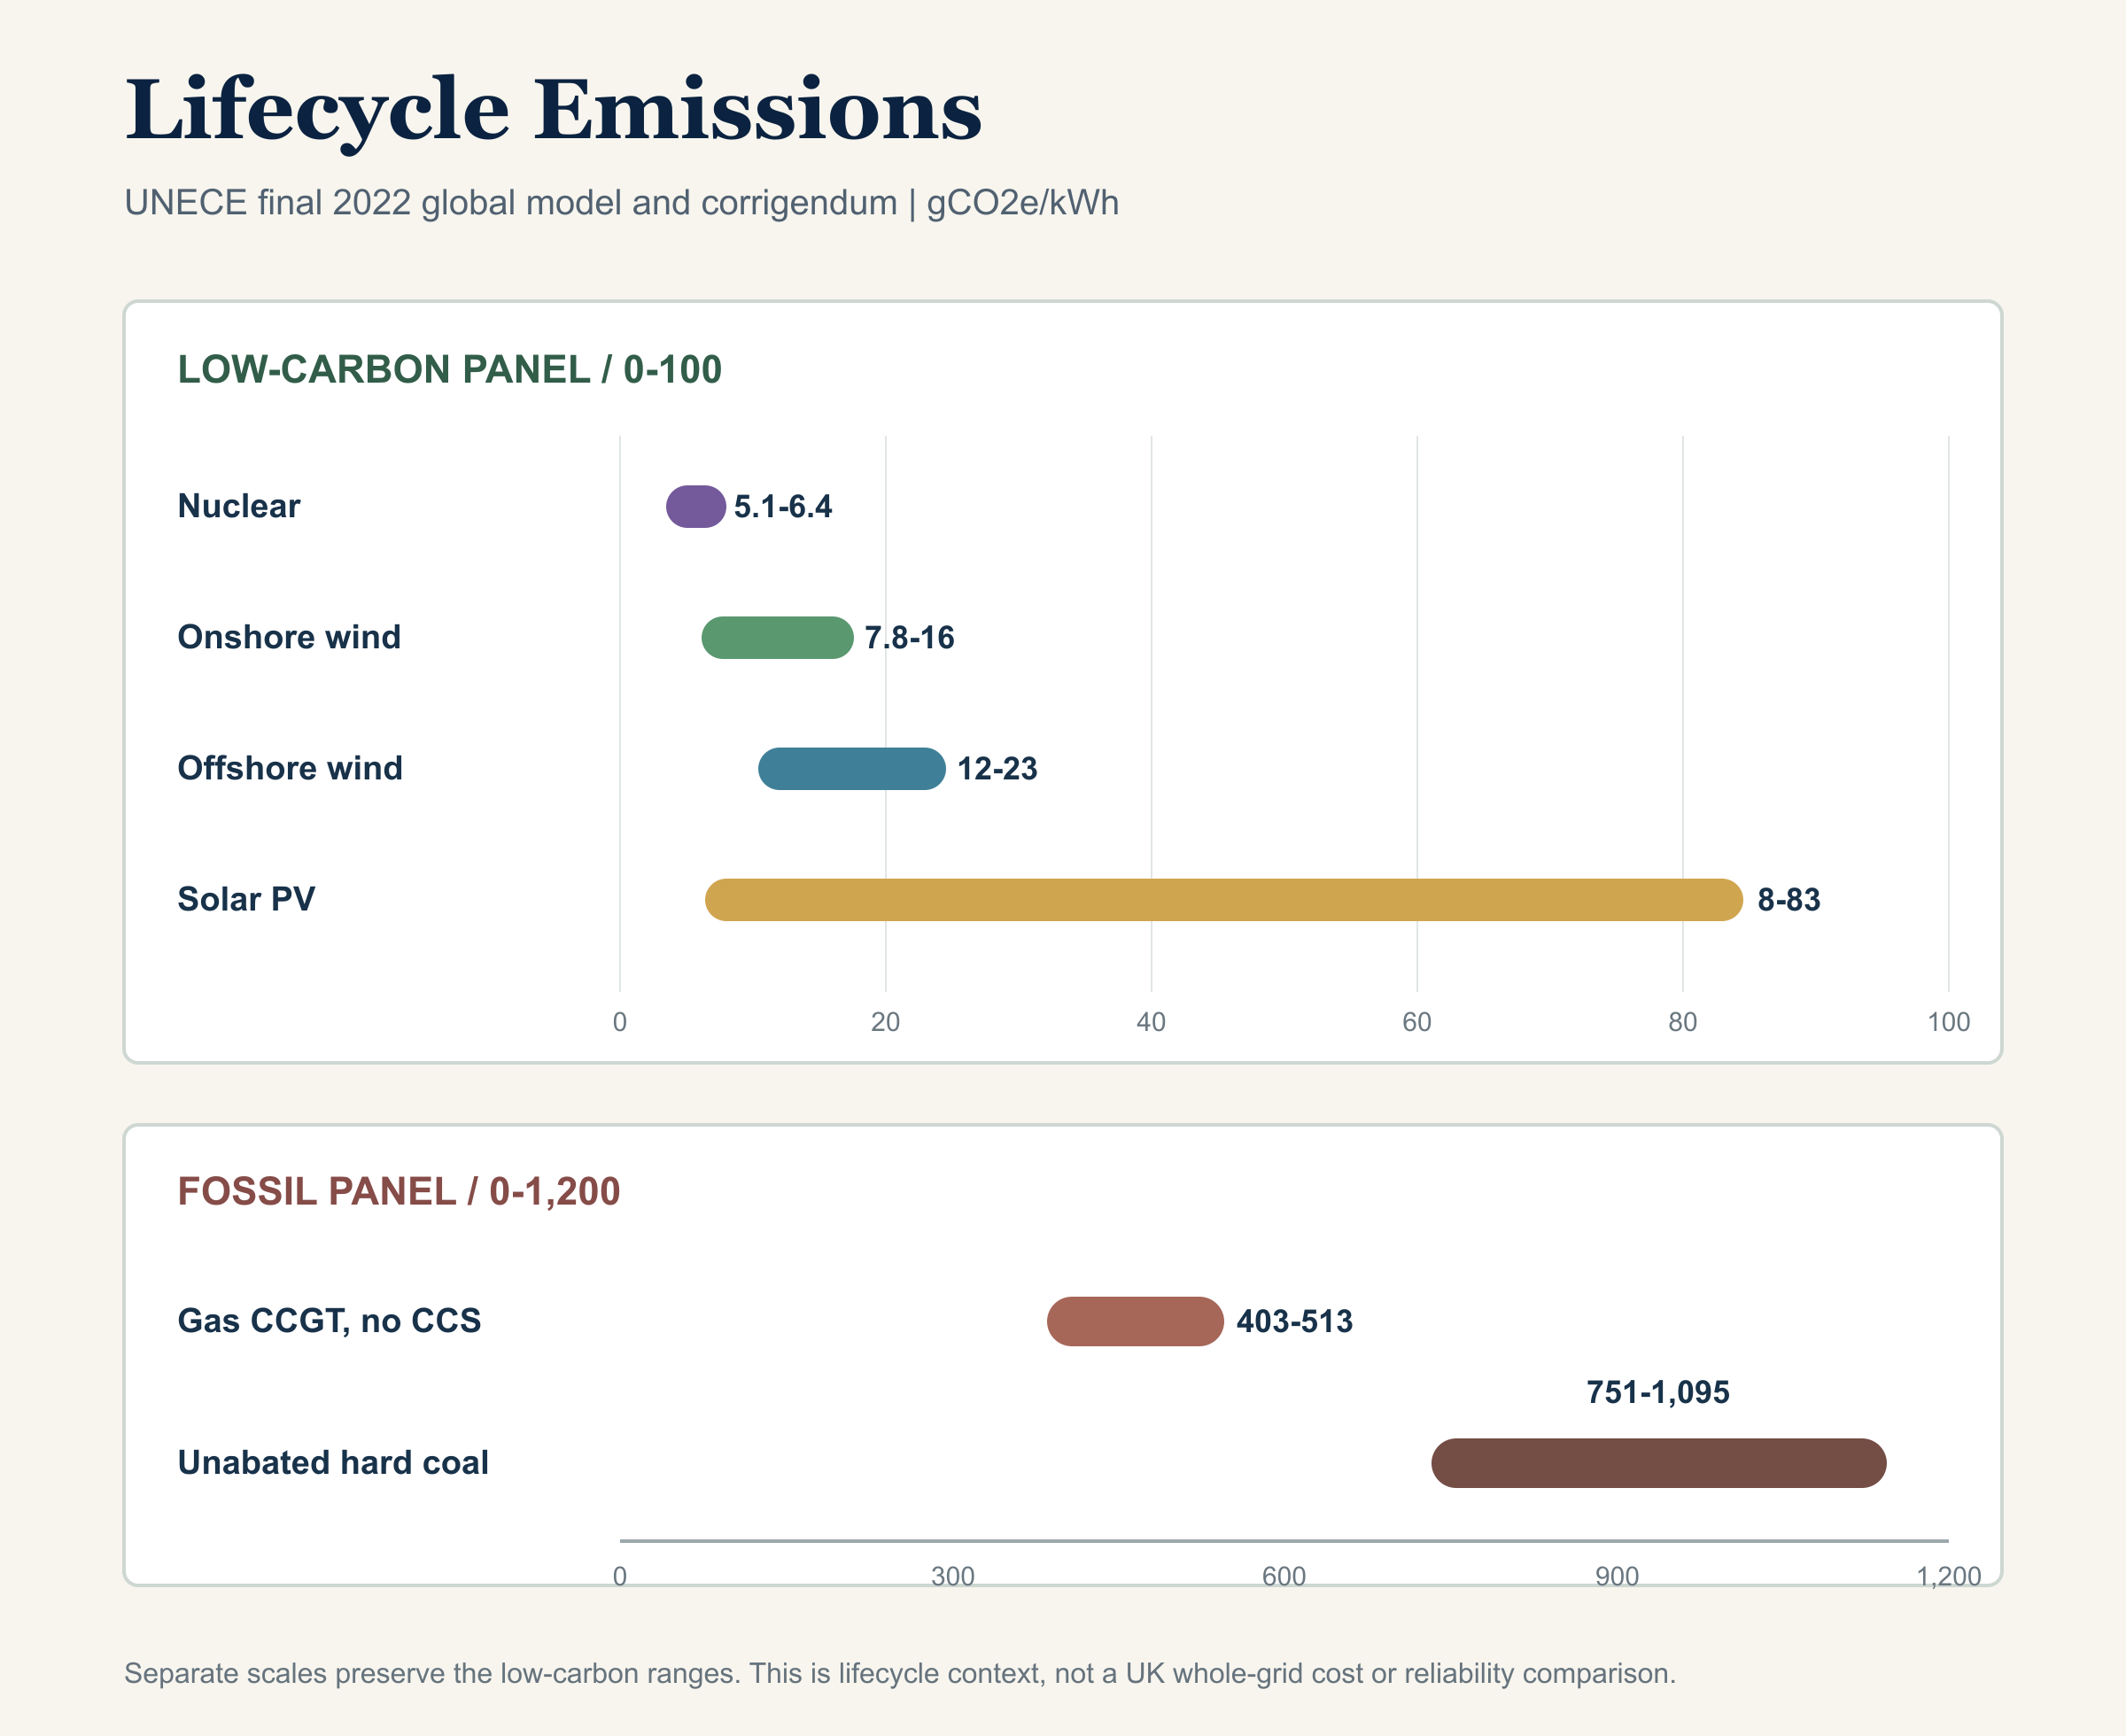
| Technology | gCO2e per kWh | Year and geography | Boundary | Status |
|---|---|---|---|---|
| Nuclear | 5.1-6.4 | UNECE global scenarios, final 2022 report and corrigendum | Lifecycle electricity generation | Modelled range |
| Onshore wind | 7.8-16 | UNECE global scenarios, final 2022 report and corrigendum | Lifecycle electricity generation | Modelled range |
| Offshore wind | 12-23 | UNECE global scenarios, final 2022 report and corrigendum | Lifecycle electricity generation | Modelled range |
| Solar PV | 8-83 | UNECE global scenarios, final 2022 report and corrigendum | Lifecycle electricity generation; technology and location range | Modelled range |
| Natural-gas combined cycle, without CCS | 403-513 | UNECE global scenarios, final 2022 report and corrigendum | Lifecycle electricity generation | Modelled range |
| Unabated hard coal | 751-1,095 | UNECE global scenarios, final 2022 report and corrigendum | Lifecycle electricity generation | Modelled range |
So yes, wind and solar require mining, processing and manufacturing. Their lifecycle emissions are not zero. But the evidence does not support the leap from "not zero" to "therefore no better than continuously burning fossil fuel".
The distinction is that most of the wind and solar burden is paid up front in the plant, while a fossil plant must keep extracting, transporting and burning fuel for every unit of electricity it produces.
What this article does not count
This is not a complete electricity-system cost comparison.
I have not added batteries, wider transmission expansion beyond plant connection and export assets, balancing, reserve generation, system curtailment or the cost of keeping supply and demand matched every second. Those are real questions. They depend on the whole grid mix, location, interconnection, demand flexibility and operating rules, not just one technology in isolation.
They deserve their own article rather than being smuggled into one side of this comparison.
I have also not compared food and electricity through a false common measure. Land competition, farming coexistence and environmental quality need site-specific judgement.
Renewable does not mean free
I think the phrase still works, provided we use it precisely.
Wind and sunlight are renewable flows. Steel, concrete, copper, glass, silicon, silver and composites are not. Nor are landscapes, marine environments, factories, ports or people's consent.
The goal should not be to pretend that clean infrastructure has no cost. It should be to make the cost visible, reduce it, recover the materials, choose the right places and compare the full working life fairly.
That gives us a much more useful question:
How do we build energy systems that return far more useful electricity than the energy and materials we invest, while taking responsibility for every stage of their life?
That is less comfortable than a slogan. It is also much closer to engineering.
Related reading
Sources and notes
- DESNZ: Renewables Obligation load factors for 2026 to 2027. The annual-output chart is Tony Wood's calculation: installed MW x 8,760 hours x load factor.
- IEA PVPS: Life Cycle Inventories of Photovoltaic Systems, 2026. The report distinguishes measured industry data, manufacturer data, retained older inventories and modelled advanced-production datasets.
- NREL: Life Cycle Assessment of Utility-Scale Photovoltaics, 2024. Source for the utility-scale silicon PV energy-payback range.
- European Commission JRC: Updated material intensities for wind turbines, 2024. Includes turbines and foundations and separates generator types.
- European Commission JRC: Raw materials demand for wind and solar PV, 2020. Used for material categories and the warning that future demand depends strongly on technology and material-intensity improvements.
- Vestas: V136-4.2 MW onshore wind plant lifecycle assessment, 2022. Vendor-authored, externally reviewed German medium-wind case with a 20-year assumed life.
- Vestas: V236-15 MW offshore wind plant lifecycle assessment, 2024. Vendor-authored, externally reviewed North Sea high-wind case with a 30-year assumed life.
- UNECE: Life Cycle Assessment of Electricity Generation Options, final 2022 report and corrigendum. Used only for the harmonised contextual emissions chart.
- US Department of Energy: Wind Energy End-of-Service Guide. US evidence is labelled and not presented as current UK waste practice.
- US Department of Energy: Agrivoltaics and solar-agriculture co-location.
- Defra: The Land Use Framework for England, 2026. Its 2050 renewables land figure is a simple trend-based extrapolation with acknowledged uncertainty, not a fixed allocation or detailed scenario.