
I was listening to a podcast in which both sides confidently said that renewable electricity was cheaper than gas, coal and nuclear.
Then somebody said renewables were not subsidised any more.
Somebody else replied that oil and gas were subsidised too.
I found myself thinking: what exactly are we comparing?
Is it the cost of building a power station? The average cost of every megawatt hour it produces over thirty years? The contract price that protects its owner? The cost of connecting it to the grid? The cost of keeping the lights on when it is not producing? The tax treatment? The cost of dismantling it?
All of those are legitimate numbers. They are not the same number.
So I went looking for the least exciting answer possible: the official assumptions, the project accounts, the contracts, the balancing reports, the network settlements and the support mechanisms.
Then I had to ask a second question: who produced those numbers, who commissioned them, and what outcome are they institutionally set up to pursue? An official source can be useful without being independent. A sceptical source can expose a weak assumption without being right about everything. The source audit is therefore part of the evidence, not a footnote.
I expected the cheap-renewables claim to dissolve once I opened the spreadsheets.
It did not.
The biggest surprise in this research was that the narrow claim is broadly true. Under more than one current cost model, new onshore wind and large solar really are very cheap ways to produce bulk annual electricity. The exact number changes with the financing rate, location, load factor, project year and cost assumptions. The direction does not disappear.
But the word cheap needs a boundary. A solar farm produces variable energy. A nuclear station, gas turbine, battery, interconnector and transmission line provide different combinations of energy, firmness, flexibility, location and insurance. A cheap generating plant is not automatically a cheap complete electricity system.
So the conclusion is not a slogan.
Under current official assumptions, onshore wind and large solar are among the cheapest ways to add bulk annual electricity in Britain. They are still supported. Gas can provide valuable flexibility, but becomes very expensive per unit when it is kept for occasional use. Nuclear provides long-lived firm power, but its financing and construction record dominate its economics. And none of those plant-level figures is the cost of the electricity system as a whole.
This article uses public information available on 15 August 2026. Most generation comparisons are for Great Britain because Northern Ireland has a different electricity market. Tax and oil-refining evidence is UK-wide.
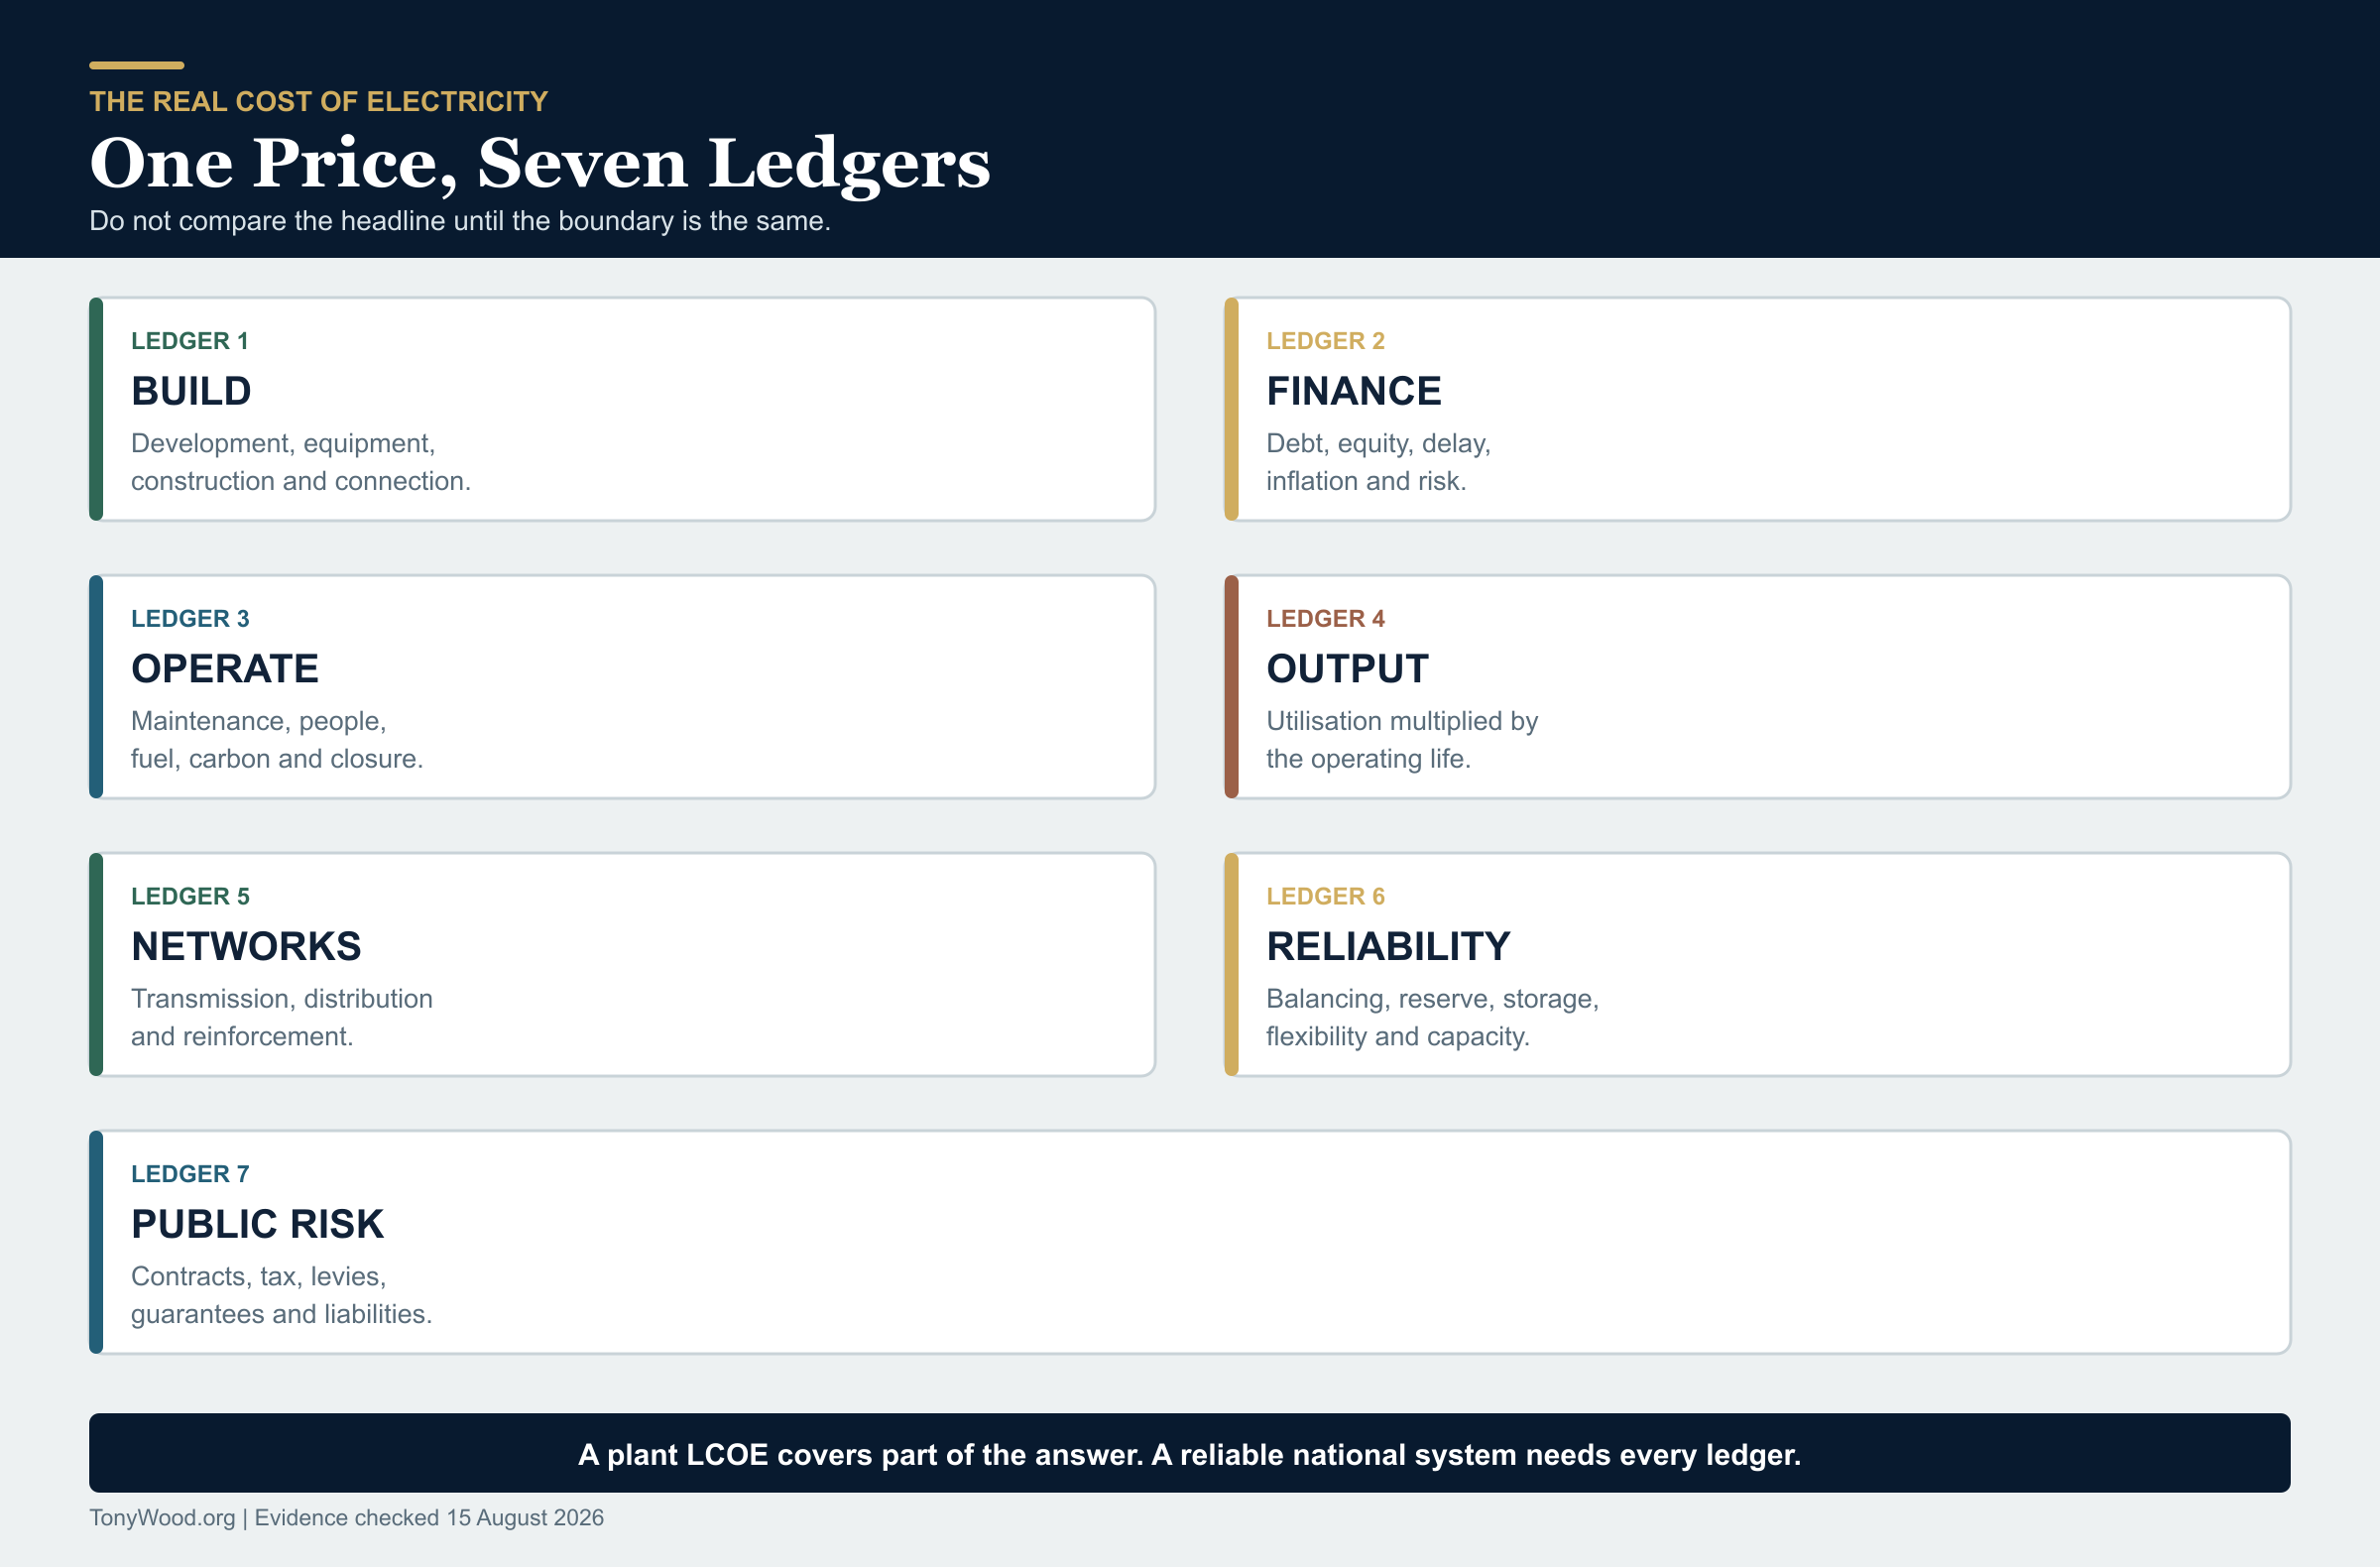
The seven ledgers behind the word cost
- Development and construction: land, planning, equipment, civil engineering, connection assets and the years during which capital is tied up.
- Finance: debt, equity, risk, inflation and the cost of waiting for a project to produce its first unit of electricity.
- Operation: maintenance, staff, fuel, carbon, insurance and eventual decommissioning.
- Lifetime output: how many years it operates and how much electricity one installed megawatt actually produces.
- Networks: local connection, transmission, distribution, reinforcement and moving power from where it is produced to where it is needed.
- Reliability: balancing, reserve, storage, interconnection, demand flexibility and firm capacity for periods of stress.
- Public support and risk: price guarantees, capacity payments, regulated returns, tax relief, public investment, underwriting and legacy liabilities.
The Department for Energy Security and Net Zero uses levelised cost of electricity, or LCOE, for the first four of those ledgers at a generic plant. Its definition includes the cost of building, operating and decommissioning a plant over its lifetime, discounted back to a common date and divided by lifetime electricity output.
That means the building cost is already in the official LCOE. I have nevertheless shown it separately below because a £60/MWh result hides the physical fact that somebody must first finance and construct a project worth tens of millions or several billion pounds.
DESNZ is equally clear about the boundary: LCOE is not a whole-system cost. Technologies supply different services and are expected to complement one another. Plant LCOE does not allocate wider grid, balancing or security-of-supply costs to individual technologies.
The short claim audit
| Claim | Verdict | What the evidence supports |
|---|---|---|
| Onshore wind and large solar are the cheapest new electricity. | Supported within the plant-level boundary | DESNZ's 2030 central LCOEs are £58/MWh for onshore wind and £60/MWh for large solar, in 2024 prices. That does not make them firm power or include every system cost. |
| Renewables are no longer subsidised. | False or materially overstated | New wind and solar still receive long-duration revenue protection through Contracts for Difference. Older projects can remain in the Renewables Obligation or Feed-in Tariff systems. |
| A CfD strike price is the cost of generating electricity. | False | It is a contract price and risk-allocation mechanism. Payments can flow to or from the generator relative to a market reference price. It is not an engineering LCOE. |
| Oil and gas receive no public support. | False under a broad support definition | The official inventory records production tax reliefs, decommissioning relief and consumer support. The UK also uses a narrower international price-gap definition when reporting the word subsidy. |
| Fossil tax relief can be added directly to renewable levies. | False comparison | They differ in taxpayer, beneficiary, purpose, timing and counterfactual. A tax expenditure is not the same accounting object as a bill-funded generation contract. |
| LCOE is the total cost of the electricity system. | False | DESNZ explicitly warns against using plant LCOE as a whole-system comparison. |
| All of the proposed £58 billion transmission programme is a wind subsidy. | False | NESO's Beyond 2030 plan is multi-purpose national infrastructure for generation, demand, resilience and interconnection. It cannot be charged mechanically to one source. |
| Every renewable megawatt hour requires one storage megawatt hour. | False | A portfolio uses diversity, flexible demand, interconnectors, curtailment, storage and dispatchable generation. The requirement depends on weather, demand and the rest of the system. |
| Gas electricity is cheap. | Context-dependent | DESNZ's same CCGT model is £109/MWh at high utilisation, £147/MWh at medium utilisation and £424/MWh at low utilisation. A plant that runs rarely spreads its capital and fixed costs over fewer units. |
| There is a current official nuclear LCOE directly comparable with wind and gas. | Not supported | DESNZ does not publish a current generic nuclear LCOE because live project costs and financing are commercially sensitive. Contract and project-cost figures answer different questions. |
| France proves that a new nuclear station costs about EUR 60/MWh. | False comparison | The French regulator's EUR 60.3/MWh figure is the full-cost estimate for EDF's existing 57-unit fleet in 2026 to 2028. It is valuable evidence for operating an established fleet, not a new-build LCOE. |
| UK building regulations make nuclear a known percentage more expensive than France. | Not established | Hinkley is more expensive per GW on selected published construction figures, but the Office for Nuclear Regulation says its requirements are not the principal reason for the additional steel and concrete. |
| Coal remains a normal new-build UK option. | False as a current comparison | Great Britain's last coal station closed in 2024. Historical coal costs do not provide a credible 2030 new-build benchmark. |
| The UK cannot refine its own oil. | False or overstated | UK refineries produced 50.8 million tonnes of products in 2024. Crude chemistry, product demand, shipping and refinery economics explain the large two-way trade. |
| More UK oil would automatically justify a new refinery. | Unresolved commercial and policy judgement | A refinery is technically possible, but it is a long-lived, capital-intensive asset facing changing demand and competition from larger international sites. |
What the official 2030 plant figures actually say
The table below uses the central 2030 cases in the DESNZ Electricity Generation Costs 2025 report and its published assumptions workbook. All money is real 2024 pounds. The figures are modelled estimates for generic projects reaching operation in 2030, not invoices from actual projects.
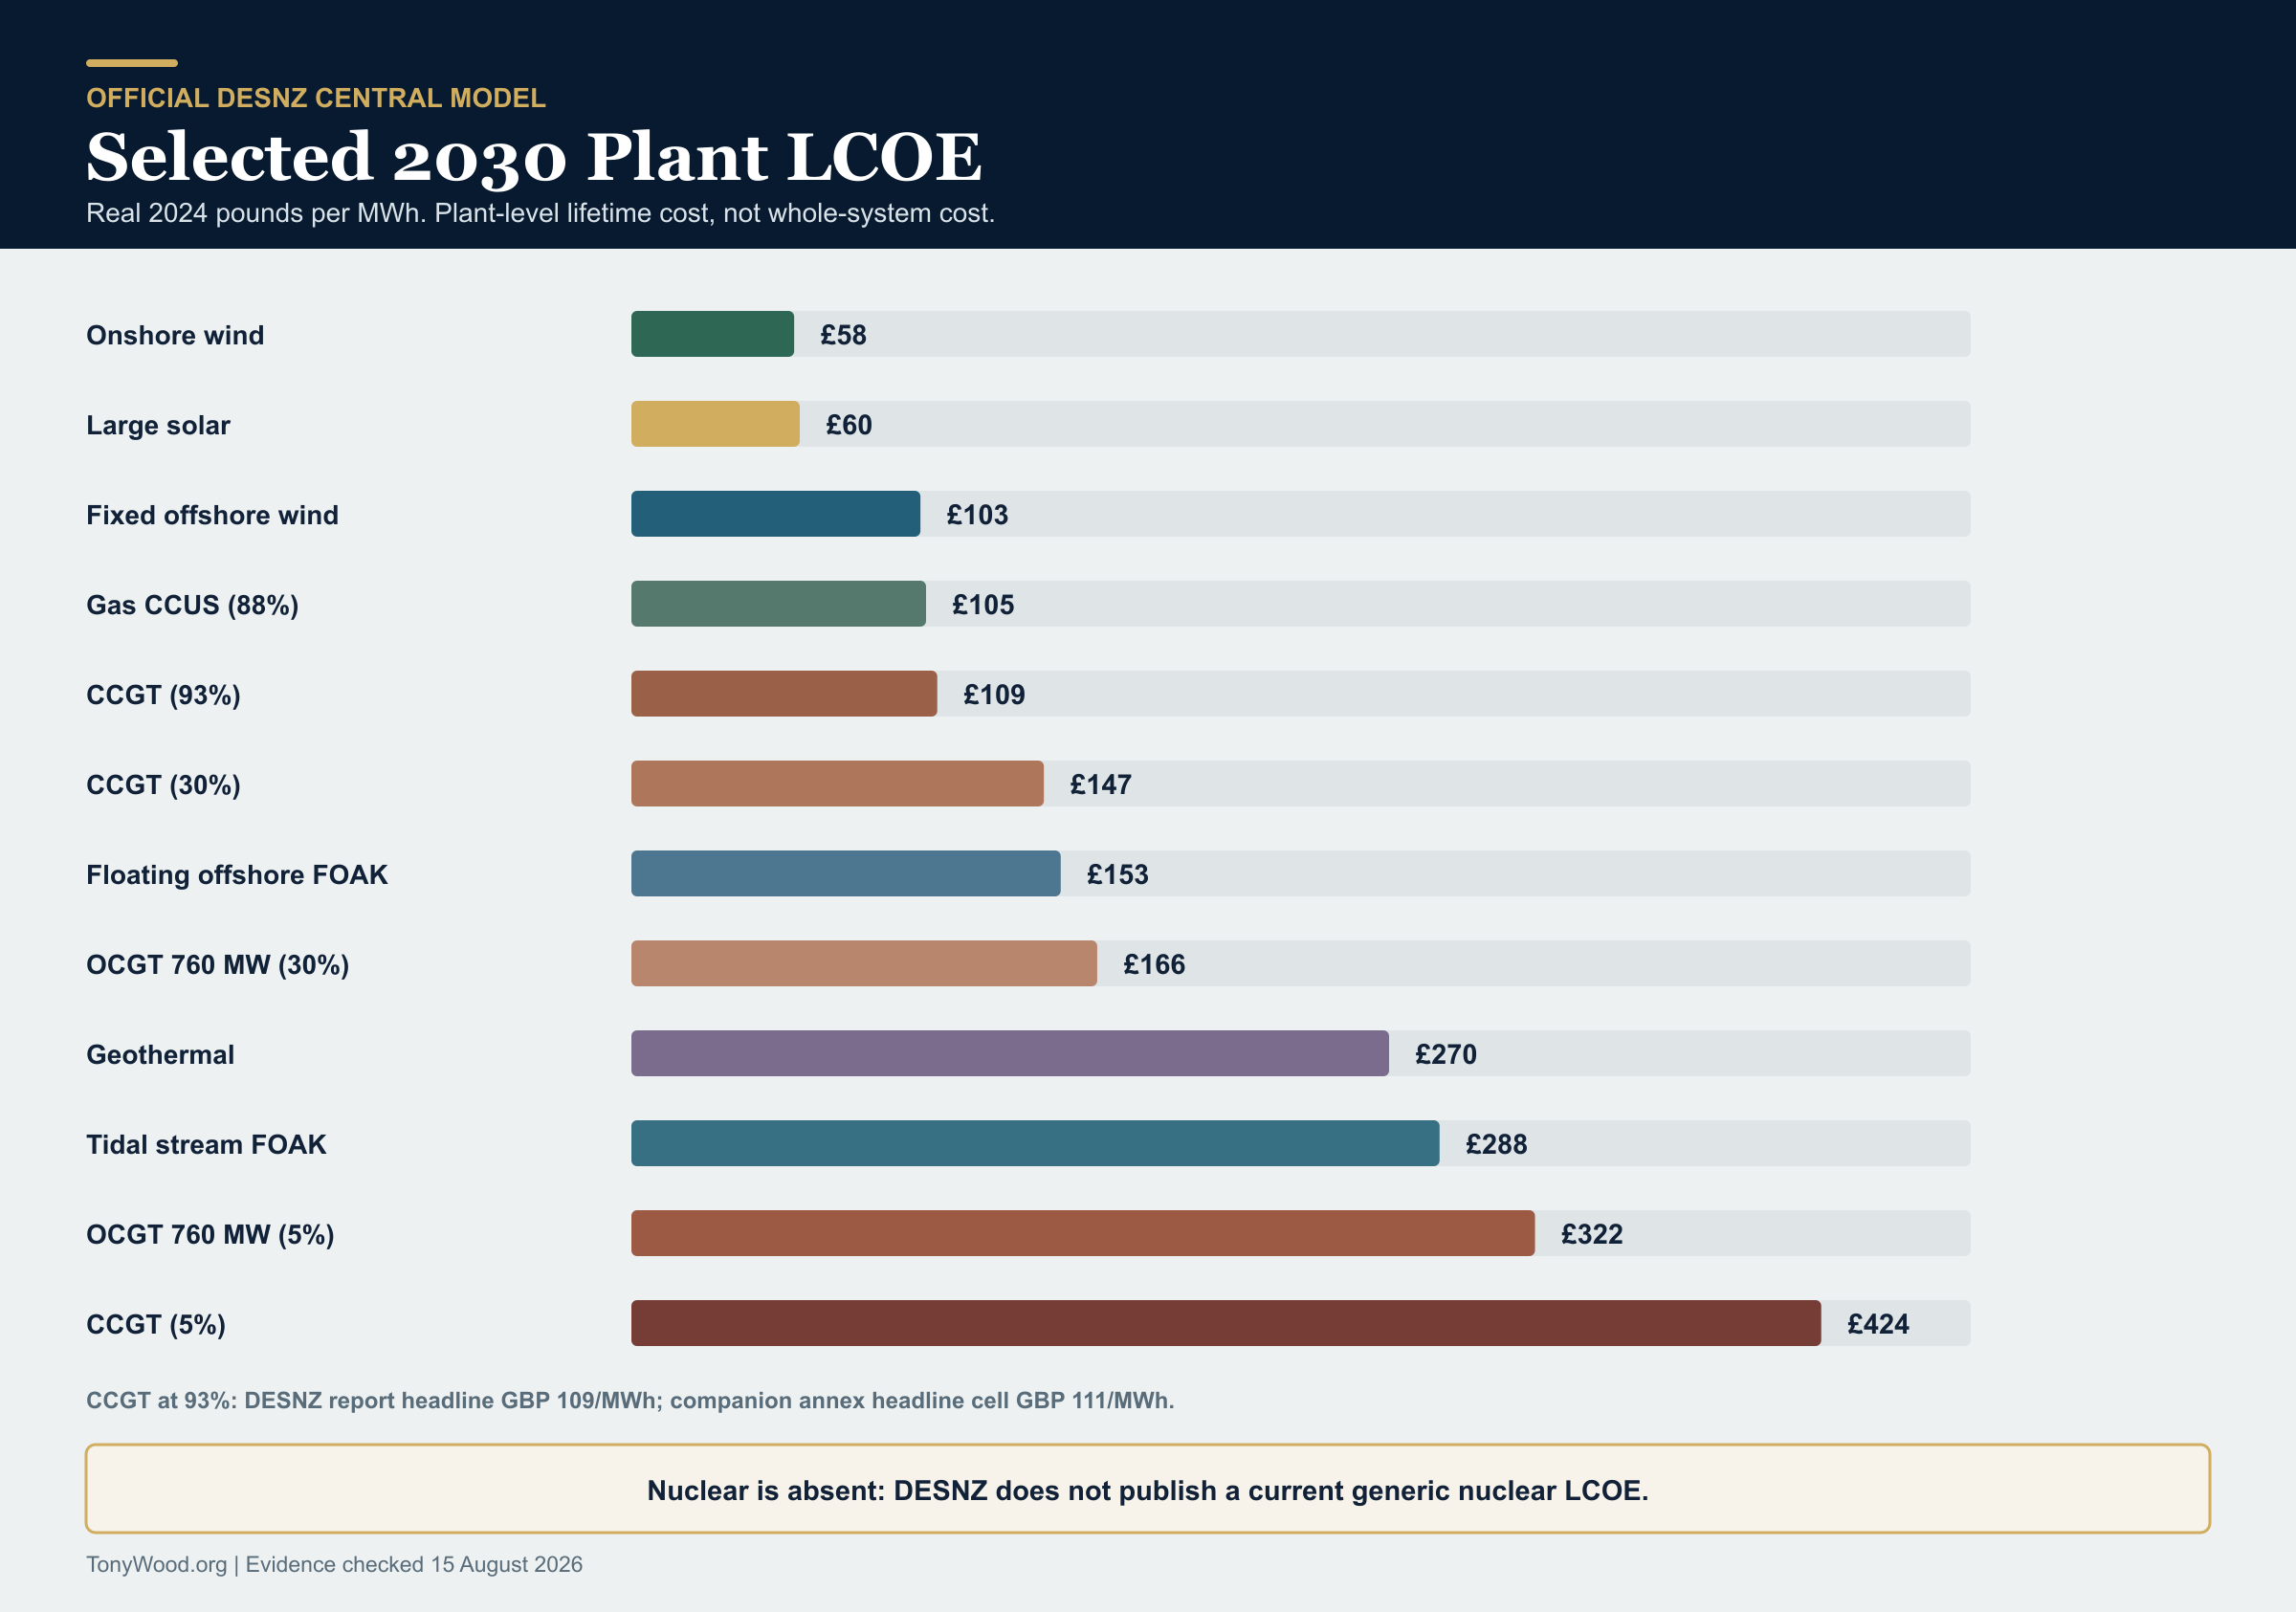
| Technology and case | Total | Pre-development | Construction | Fixed O&M | Variable O&M | Fuel | Carbon | Decommission |
|---|---|---|---|---|---|---|---|---|
| Onshore wind | 58 | 3 | 42 | 13 | - | - | - | <1 |
| Large solar | 60 | 2 | 48 | 9 | - | - | - | <1 |
| Fixed offshore wind | 103 | 6 | 63 | 34 | - | - | - | <1 |
| Gas CCUS, 88% headline utilisation | 105 | <1 | 18 | 7 | 9 | 45 | 26 | <1 |
| CCGT, 93% headline utilisation | 109 | <1 | 15 | 3 | 5 | 45 | 41 | <1 |
| CCGT, 30% headline utilisation | 147 | <1 | 45 | 9 | 5 | 45 | 41 | <1 |
| Floating offshore wind, first of a kind | 153 | 8 | 114 | 30 | - | - | - | <1 |
| OCGT 760 MW, 30% headline utilisation | 166 | <1 | 25 | 5 | 5 | 68 | 62 | <1 |
| Deep granite geothermal | 270 | 8 | 231 | 31 | - | - | - | <1 |
| Tidal stream, first of a kind | 288 | 27 | 218 | 43 | - | - | - | <1 |
| OCGT 760 MW, 5% headline utilisation | 322 | 2 | 150 | 32 | 5 | 68 | 62 | <1 |
| CCGT, 5% headline utilisation | 424 | 6 | 271 | 56 | 5 | 45 | 41 | <1 |
These numbers answer an important but limited question: what average revenue per MWh would a generic project need across its lifetime to cover the costs in the model?
Source reconciliation: the DESNZ report gives £109/MWh for the 93% CCGT case. A headline cell in its companion annex displays £111/MWh, while the published component rows shown above add to £109/MWh before the two less-than-£1 rounded items. I use the report's headline £109/MWh and state the discrepancy rather than hiding it.
They do not say that a megawatt hour from a solar farm at noon provides the same system service as a megawatt hour from a gas turbine during a cold, still evening. Nor do they say that a gas plant intended as insurance should be judged only on how many units it sells.
Does the cheap wind and solar result survive a reality check?
Yes, as a plant-level conclusion. No, as a precise universal price.
The DESNZ model is not simply an unsupported departmental guess. DESNZ commissioned Arup to refresh the onshore-wind and large-solar evidence. Arup contacted more than 100 organisations, received data covering 45 projects, checked submissions for completeness and outliers, and compared them with internal and external benchmarks. DESNZ then applied its own financing and load-factor assumptions when producing the final official figures.
That is a serious method, but it is not perfect verification. Much of the project evidence is commercially confidential, developer submissions can carry selection bias, and a generic 2030 plant is still a model rather than a completed invoice. The right test is whether other evidence points in roughly the same direction.
| Evidence | Wind and solar result | What it validates | Important boundary |
|---|---|---|---|
| DESNZ 2025 generation-cost model | 2030 central LCOE: onshore wind GBP 58/MWh; large solar GBP 60/MWh. | The official generic-plant result used in this article. | Real 2024 pounds; excludes wider system costs and benefits. |
| Arup's commissioned current-cost study | Medium cases: onshore GBP 45.8/MWh; solar GBP 46.5/MWh. Full ranges were GBP 27.2 to 90.6 and GBP 30.3 to 65.2. | Recent project evidence and benchmark work support low central plant costs. | Real 2023 pounds and current 2023 to 2024 cost evidence, with different hurdle rates and load-factor treatment from final DESNZ figures. |
| Climate Change Committee and AFRY | 2030 solar LCOE GBP 34/MWh and offshore wind GBP 38/MWh; wind and solar form the low-cost backbone of its pathway. | A separate UK pathway model supports the broad low-cost-renewables conclusion. | Real 2023 pounds; its system also includes grid investment, storage, flexibility, interconnection, nuclear and dispatchable low-carbon generation. |
| Lazard LCOE+ 2026 | Its latest US analysis again ranks unsubsidised renewables as the lowest-cost new-build generation, while reporting that wind and solar costs have risen. | A private financial adviser using a different market reaches the same broad plant-level ranking. | US market and financing assumptions; not a UK price forecast. Lazard also says a diverse fleet, grid investment and reliability still matter. |
| Fraunhofer ISE 2024 | Its German model puts ground-mounted solar and onshore wind at EUR 41 to 92/MWh across the combined range and calls them Germany's lowest-cost power-plant technologies. | A non-UK research model supports the direction of the result. | Germany, 2024 and modelled LCOE. Fraunhofer is an energy-transition research institute, not an adversarial UK cost audit. |
| UK CfD Allocation Round 7 | 2024-price strike prices: solar GBP 65.23/MWh; onshore wind GBP 72.24/MWh; most fixed offshore wind GBP 91.20/MWh. | Real market awards show investable renewable prices in broadly the same territory, although above the DESNZ central solar and onshore cases. | A strike price includes contract terms, risk allocation and revenue assumptions. It is not LCOE. |
Who is behind the numbers?
This is the uncomfortable but necessary question. The exact UK central numbers do lean heavily on institutions working within the UK's net-zero policy framework. Five links do not necessarily mean five independent opinions.
| Source | Who produced or commissioned it? | Institutional position | What it can establish | What it cannot establish |
|---|---|---|---|---|
| DESNZ generation costs | The UK government department responsible for energy security and net zero. | Policy-aligned official model. | A transparent common set of assumptions for generic GB projects. | Independent validation of the government's own policy assumptions, or a complete system cost. |
| Arup current-cost study | A private engineering consultancy commissioned by DESNZ; primary submissions came from renewable developers. | Technically separate, but not independent of the commissioning department or industry sample. | Recent project evidence, ranges and a documented collection method. | A blind replication using public invoices from a random sample. |
| CCC and AFRY pathway | The CCC is an independent statutory body created by the Climate Change Act; AFRY supplied commissioned modelling. | Independent of ministers, but explicitly mandated to advise on emissions targets and carbon budgets. | A coherent low-carbon pathway with networks, storage and firm capacity included. | An institutionally neutral test of whether net zero should be pursued. |
| CfD Allocation Round 7 | Private developers bidding into a government-designed support contract. | Market-revealed within a policy mechanism. | The prices at which projects accepted long-term contracts under those rules. | Unsubsidised LCOE or the total consumer cost of the system. |
| Lazard 2026 | A private financial advisory and asset-management firm using US industry data and public information. | Independent of UK net-zero policy, but commercial and US-specific. | A useful international new-build cost benchmark. | A forecast for a British project or British grid. |
| Fraunhofer ISE 2024 | A German applied-research institute specialising in solar and energy systems. | Non-UK research, but closely engaged with the energy transition. | A separately modelled German technology comparison. | An adversarial audit of UK assumptions. |
| NAO and Cour des comptes | Independent public auditors reporting to the UK and French public systems. | Institutionally independent audit evidence. | Whether public contracts, project costs and accounts are reported and governed properly. | A generic future LCOE for every technology. |
| Peer-reviewed GB system-cost research | Academic researchers published in Energy Economics. | Independent academic modelling. | That location, congestion and reserve costs can materially change the value of extra renewable output. | One permanent national surcharge for every wind or solar MWh. |
| Gordon Hughes / Renewable Energy Foundation | An academic analysis hosted by a charity founded because it considered UK energy debate unbalanced; the work uses wind-project company accounts. | Openly sceptical of official wind-cost claims. | A genuine challenge from historical company-account data, especially on ageing, operating cost and model optimism. | A current, peer-reviewed replacement for the 2030 DESNZ model. The analysis is older, advocacy-aligned and uses earlier project cohorts. |
So, is the evidence broad enough? Before this audit, no. The article had market and international checks, but the precise UK cost case was still too dependent on government and net-zero-aligned institutions. Counting Arup and CCC/AFRY as wholly independent confirmations overstated the diversity.
After adding the audit, the result is more defensible but also narrower. The latest UK developer bids, Lazard's private US benchmark and Fraunhofer's German research still support the direction that onshore wind and utility solar are low-cost new-build sources of bulk electricity. Independent auditors, company-account criticism and peer-reviewed system-cost work all warn that contracts, operating life, location, congestion, reserve and financing can make the realised bill materially different.
The openly sceptical evidence deserves inclusion, but not automatic promotion to equal weight. Source independence is not proof of truth, and institutional alignment is not proof of error. The correct response is to expose the mandate, test the assumptions and compare like with like.
I did not find a comparable current UK central model that reverses the basic plant-level result and makes new onshore wind or large solar an expensive source of bulk annual energy. I did find plenty that disputes false precision. Arup's high onshore case reaches GBP 90.6/MWh, auction prices are above the DESNZ central cases, and DESNZ itself says users should consider ranges.
My verdict is therefore narrower than "renewables are cheapest". It is: onshore wind and large solar are genuinely low-cost generators; the cost of turning a variable generator portfolio into a reliable national system must be assessed separately.
The building, the wait and the working life
This is the part that often disappears from a neat price-per-unit argument.
The DESNZ model does not simply divide today's hardware invoice by one year's output. It applies development assumptions, construction periods, financing rates, operating life and lifetime generation. The construction contribution in the previous table is therefore already a financed, levelised amount.
Here is the physical scale beneath four of the models.
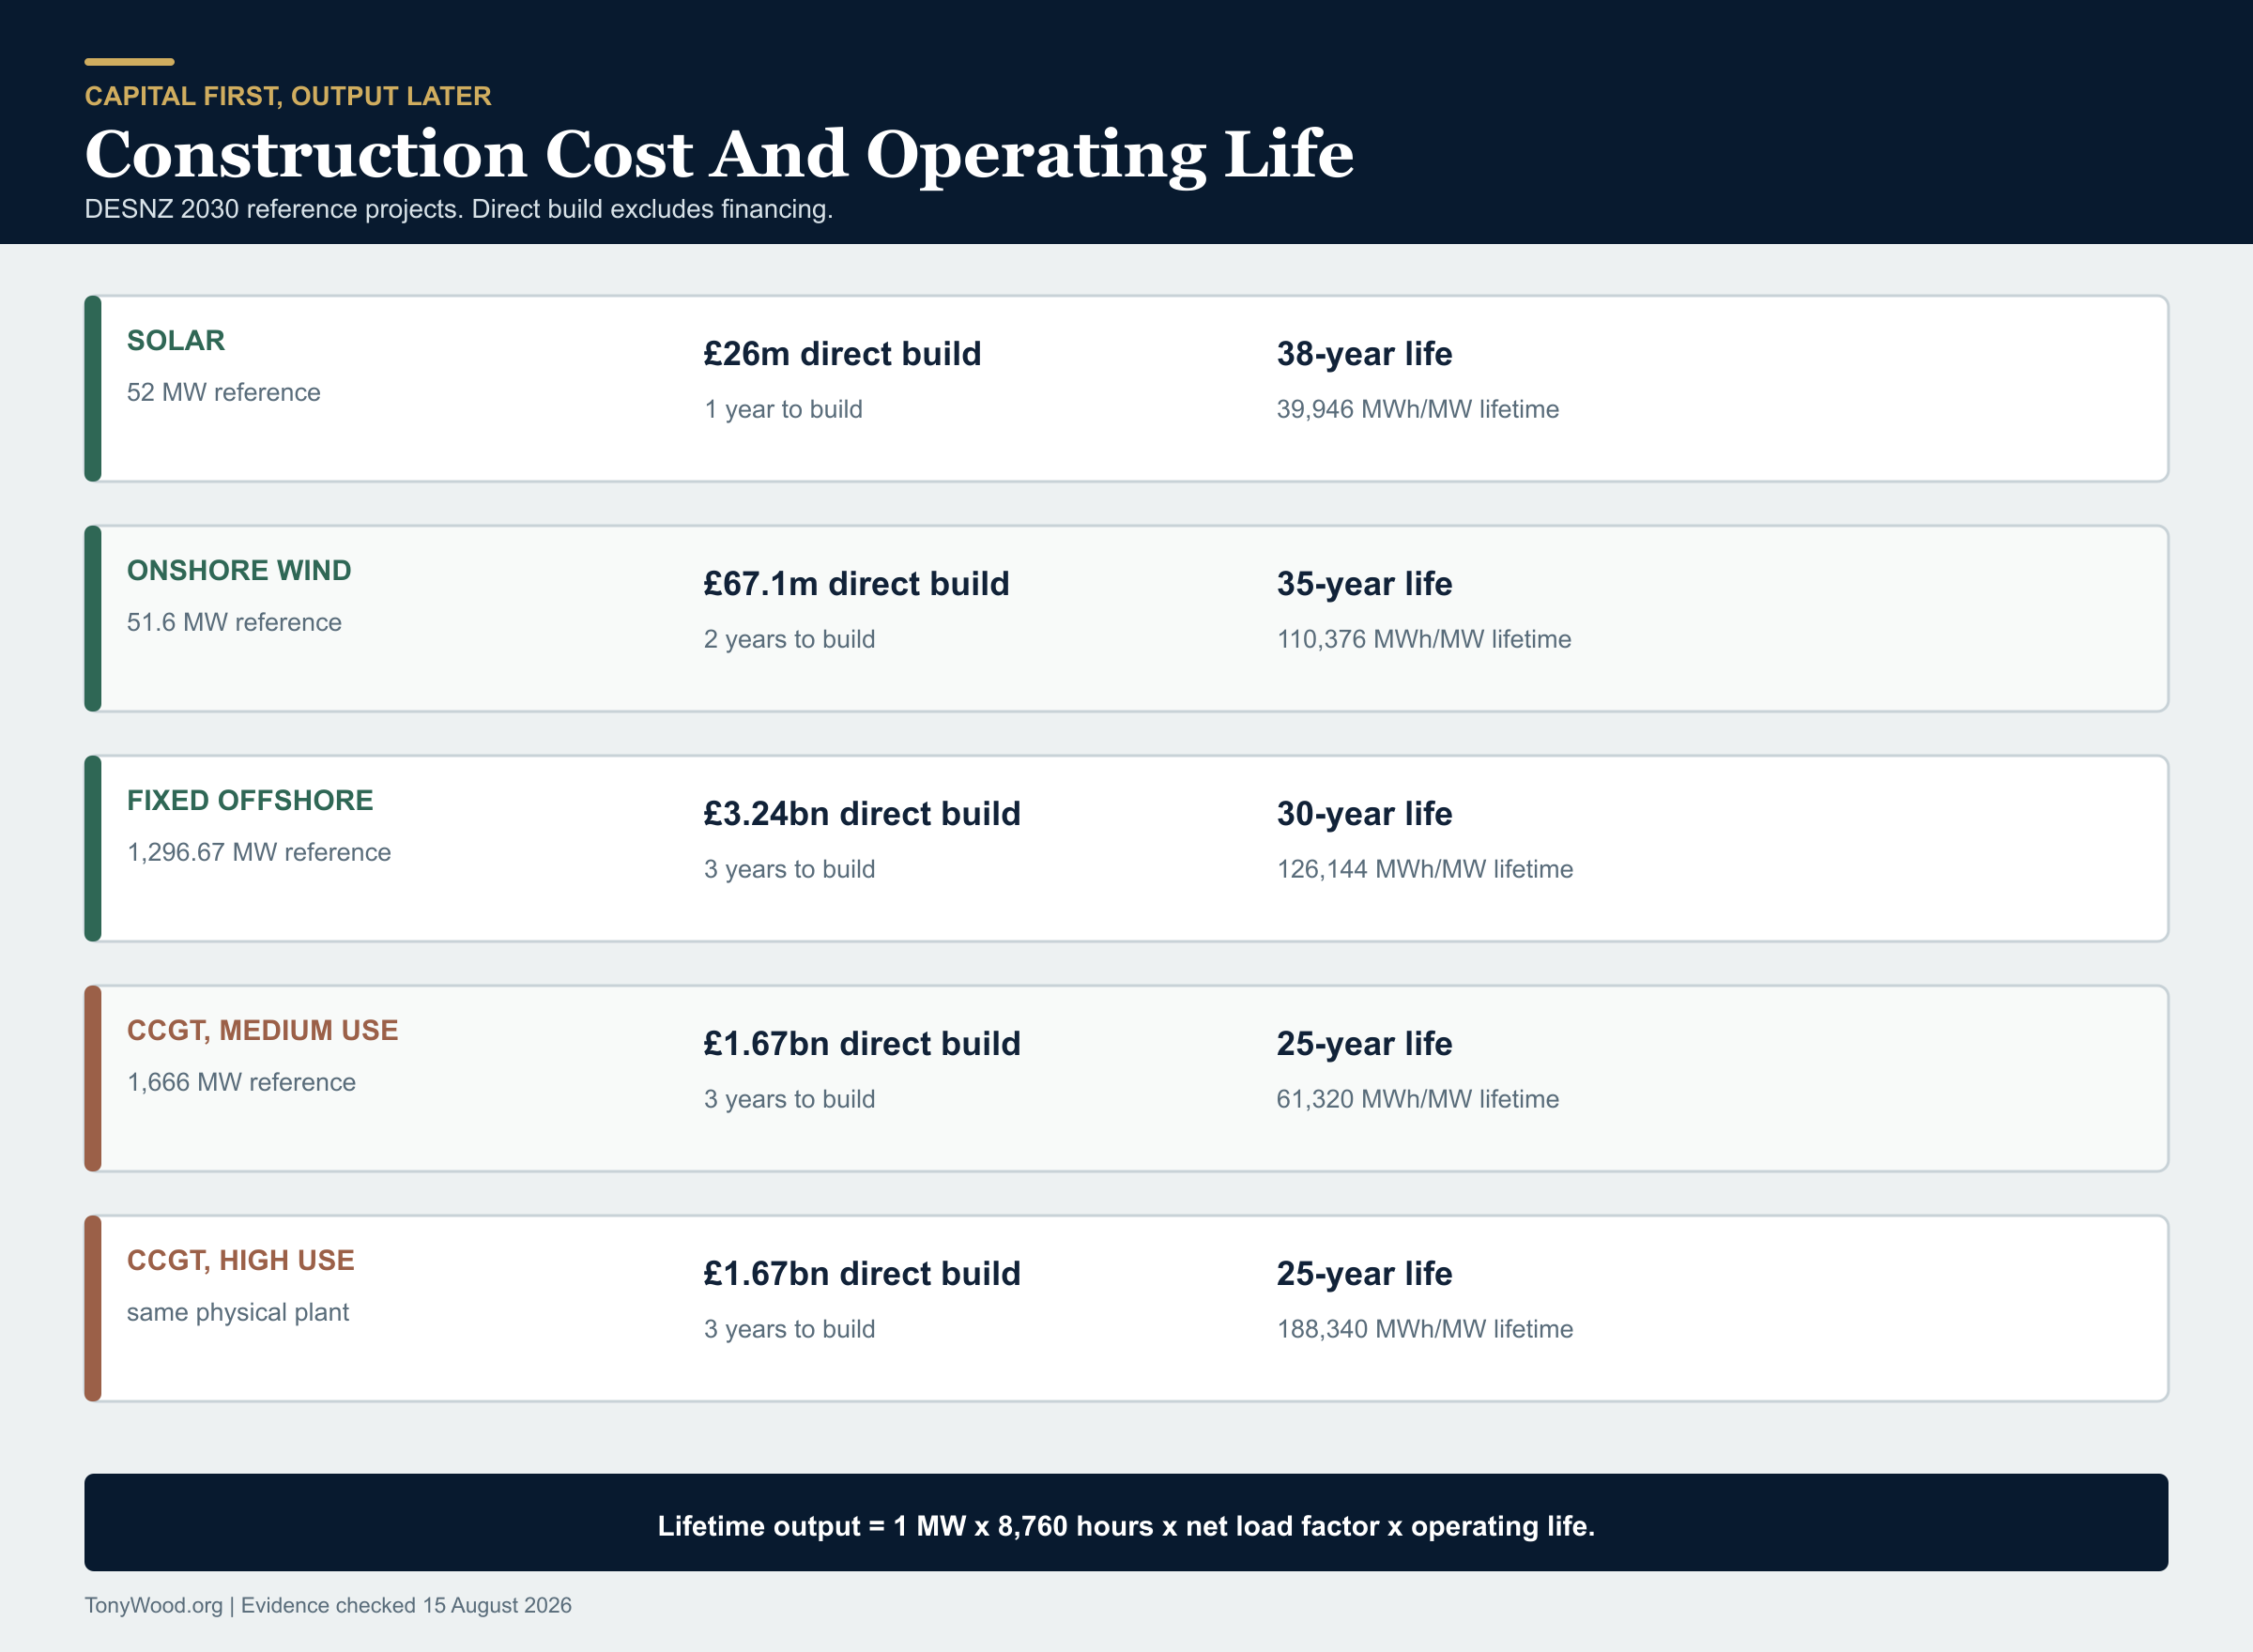
| Technology | Reference size | Direct construction cost | Reference-project direct build | Construction period | Operating life | Net load factor | Derived lifetime output per installed MW |
|---|---|---|---|---|---|---|---|
| Large solar | 52 MW | £500/kW | £26.0m | 1 year | 38 years | 12% | 39,946 MWh |
| Onshore wind | 51.6 MW | £1,300/kW | £67.1m | 2 years | 35 years | 36% | 110,376 MWh |
| Fixed offshore wind | 1,296.67 MW | £2,500/kW | £3.24bn | 3 years | 30 years | 48% | 126,144 MWh |
| Floating offshore wind, first of a kind | 1,007 MW | £3,500/kW | £3.52bn | 2 years | 28 years | Workbook project assumption | Not derived here |
| CCGT | 1,666 MW | £1,000/kW | £1.67bn | 3 years | 25 years | 28% net in the 30% headline case | 61,320 MWh |
| CCGT | 1,666 MW | £1,000/kW | £1.67bn | 3 years | 25 years | 86% net in the 93% headline case | 188,340 MWh |
Derived figures: reference-project build cost is capacity multiplied by DESNZ's £/kW assumption. Lifetime output is one MW multiplied by 8,760 hours, the net load factor and operating life. It is not a forecast for any named project.
The same workbook adds pre-development and some infrastructure assumptions before financing. For the 2030 central cases it includes about £1.6 million of pre-development plus £6.1 million of infrastructure for the 52 MW solar reference project; about £4.1 million plus £16.3 million for the 51.6 MW onshore project; and about £220 million of pre-development for fixed offshore wind. The offshore project also carries substantial connection and use-of-system costs through its operating assumptions.
This is why lifespan matters. A structure that operates for thirty-eight years can repay its construction over more output than one that operates for twenty-five, but only if the resource, reliability and maintenance assumptions hold. It is also why build time matters. A delayed nuclear station or offshore wind farm accumulates financing and opportunity cost before it earns anything.
Small changes in assumptions create large changes in the answer
DESNZ publishes ranges rather than pretending it knows the future perfectly.
| Question | Low case | Central case | High case | What moves |
|---|---|---|---|---|
| Large solar commissioned 2035 | 36 | 44 | 50 | Capital-cost assumption |
| Onshore wind commissioned 2035 | 33 | 41 | 55 | Capital-cost assumption |
| Fixed offshore wind commissioned 2035 | 50 | 59 | 72 | Capital-cost assumption |
| Floating offshore wind commissioned 2035 | 65 | 91 | 121 | Capital-cost assumption |
| 2030 CCGT utilisation | 109 at 93% headline | 147 at 30% | 424 at 5% | Capital and fixed cost spread across output |
| 2030 large OCGT utilisation | 144 at 93% headline | 166 at 30% | 322 at 5% | Capital and fixed cost spread across output |
Future renewable cost reductions are modelled expectations, not achieved invoices. Gas fuel and carbon prices are also assumptions. A table without its commissioning year, price base, utilisation, financing and technology maturity is not evidence; it is decoration.
The system around the plant is real, but not a simple adder
Britain must balance supply and demand every second, reinforce constrained routes, connect new demand and replace ageing assets. Those costs are not imaginary just because they do not sit in a solar or gas LCOE.
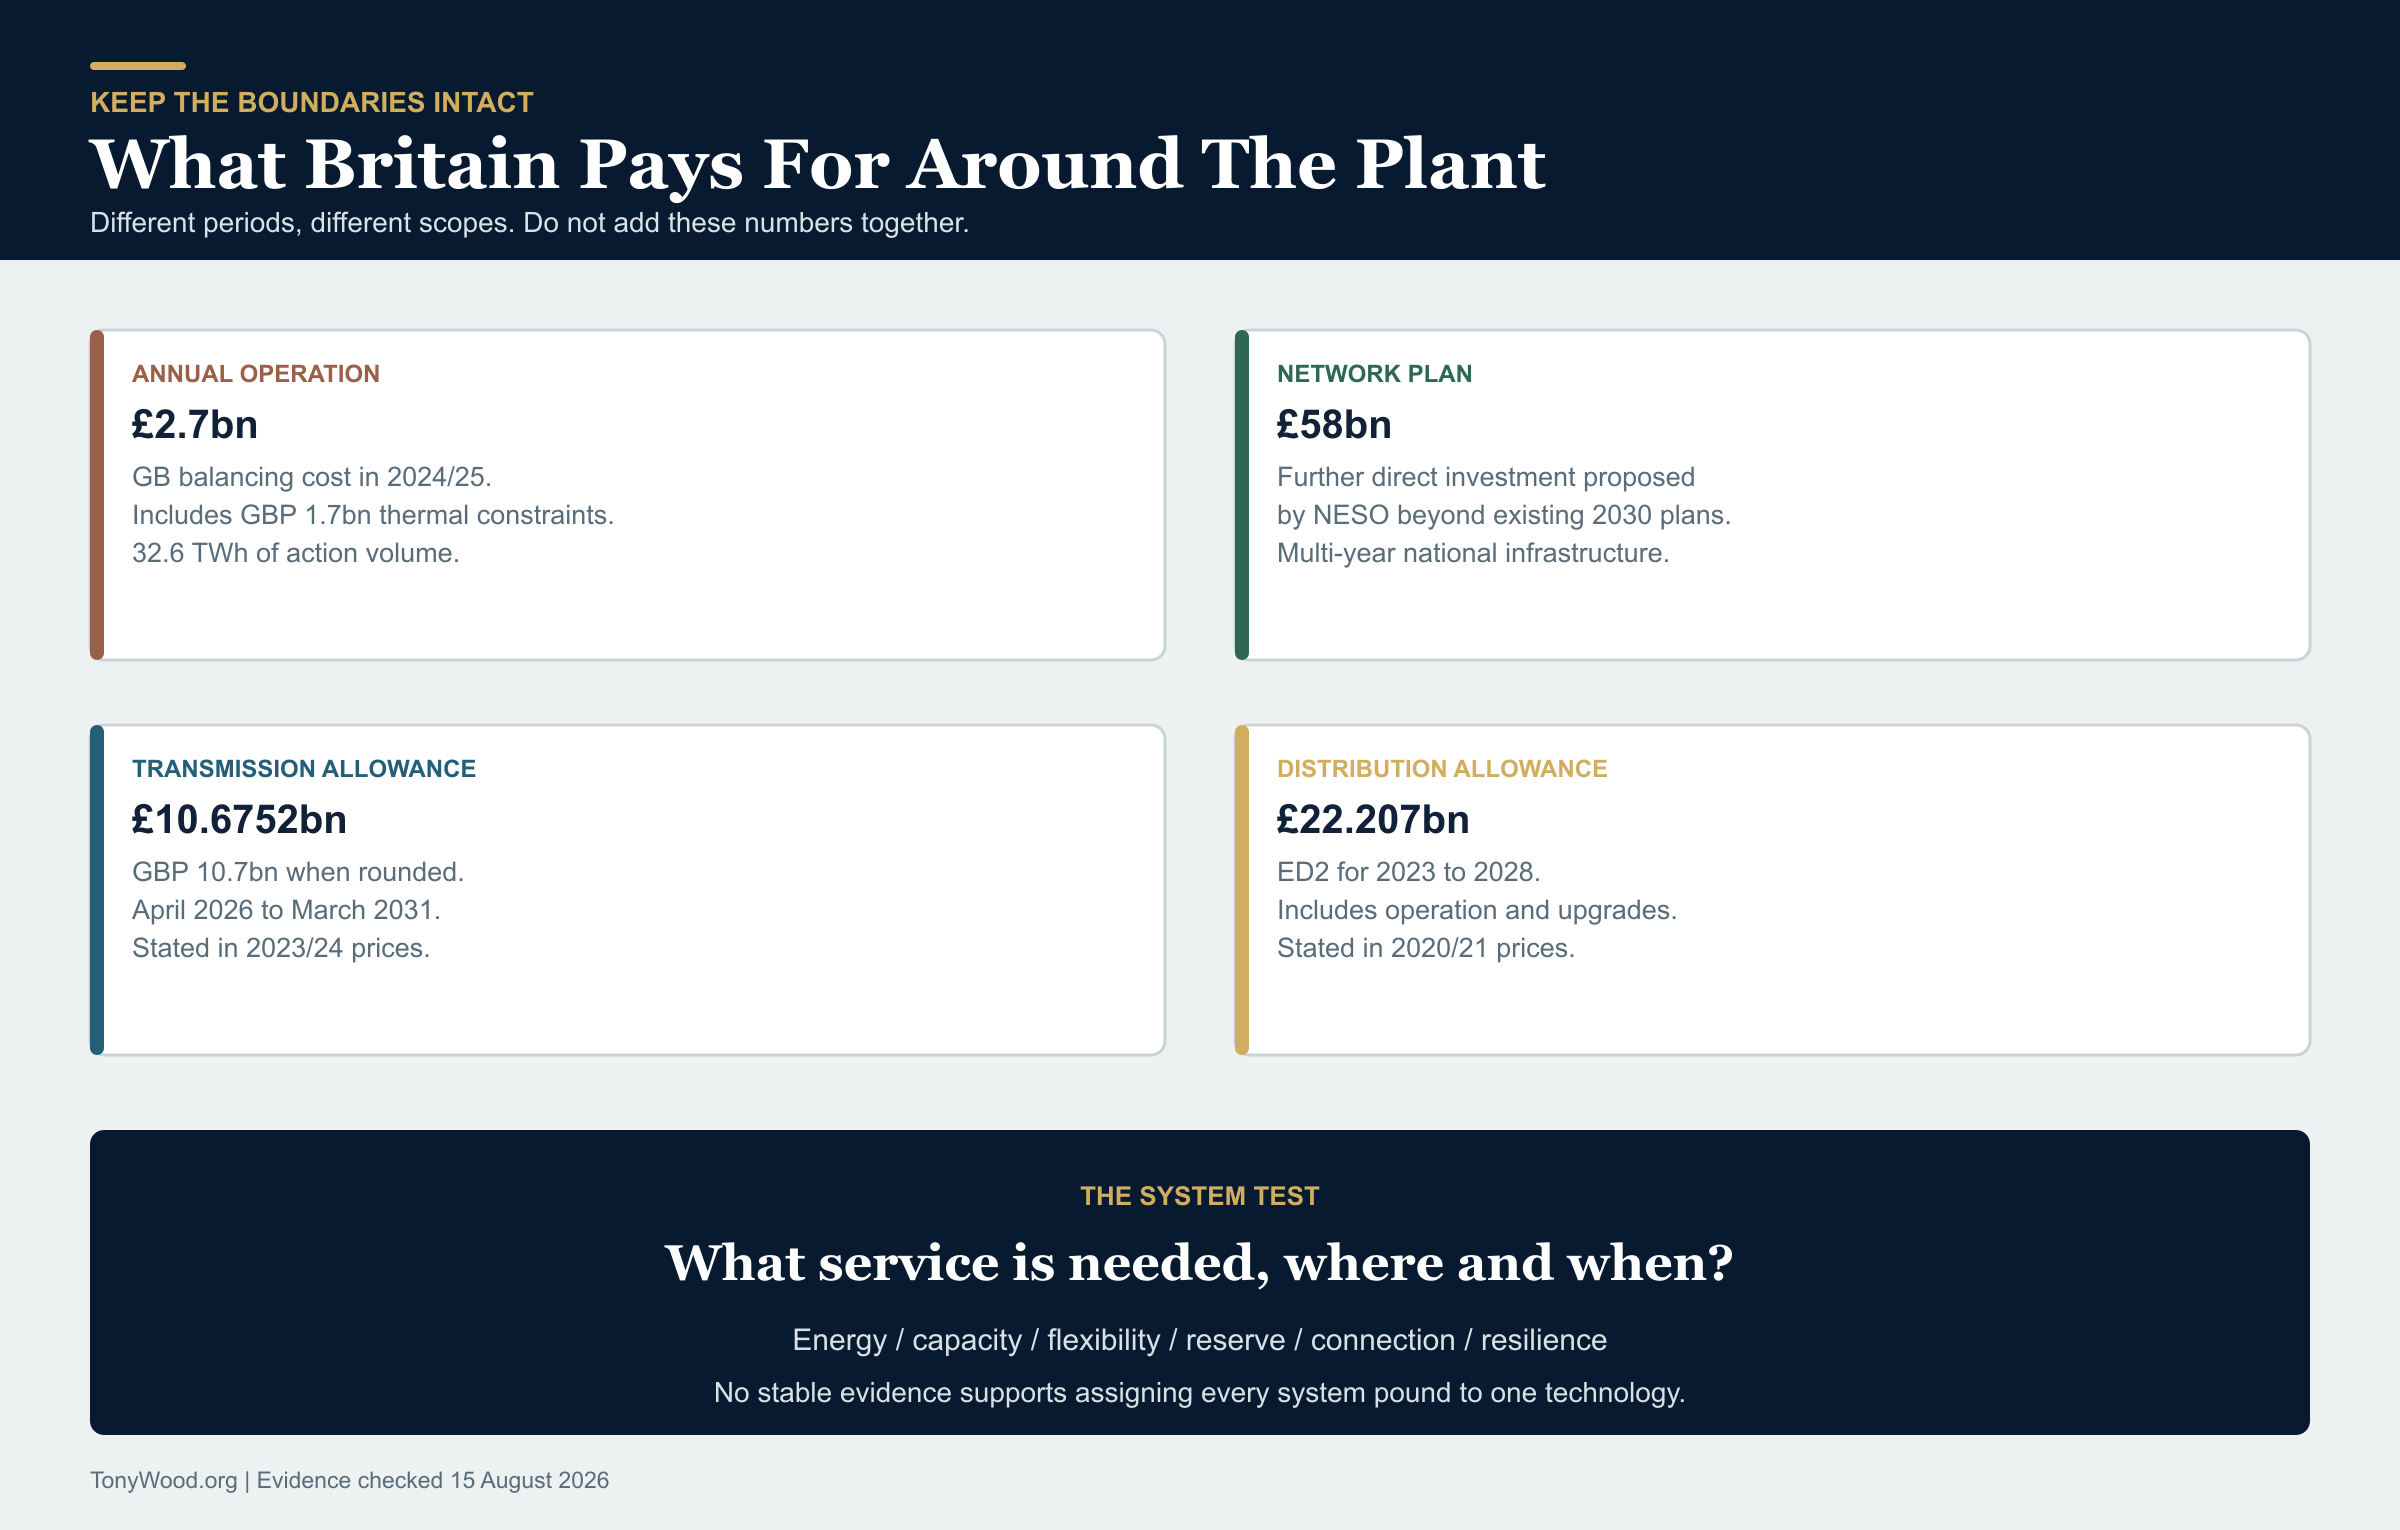
| Evidence | Amount | Period and scope | What it means | What it does not mean |
|---|---|---|---|---|
| NESO balancing costs | £2.7bn | Great Britain, 2024/25 operating year | Actions required to operate and balance the system; 32.6 TWh of action volume. | Not a one-off construction bill and not solely caused by renewables. |
| Thermal constraints within that total | £1.7bn | Great Britain, 2024/25 | Constraints rose during planned Scottish outages and high-wind periods; action volume was 13.5 TWh. | Not a permanent annual forecast. |
| NESO Beyond 2030 recommendation | £58bn | Further direct network investment proposed beyond the existing 2030 plan | Transmission needed to connect regions, generation, demand and interconnection. | Not a single-year cost or a bill that belongs to wind alone. |
| RIIO-3 electricity transmission baseline | £10.7bn | April 2026 to March 2031, 2023/24 prices; exact allowance £10.6752bn | Allowed transmission investment with a larger potential pipeline. | Not additional to every other quoted plan on a simple basis; scopes overlap. |
| Electricity Distribution 2 | £22.207bn | 2023 to 2028, 2020/21 prices | Local network operation and investment; more than £3bn supports upgrades for EVs, heat pumps and local generation. | Not a generation subsidy. |
NESO says balancing represented about 3.4% of a typical domestic bill in 2024/25, roughly £3 per month. Its report also says accelerating critical transmission projects, while avoiding wider expansion delays, could avoid up to around £4 billion of balancing costs in 2030. That is the systems argument in miniature: building a wire can be expensive and still be cheaper than repeatedly paying to work around the missing wire.
Storage has a similar boundary problem. The cost of a battery depends on power, energy duration, cycling, degradation, charging price and which service it earns money from. Long-duration storage, short batteries, interconnectors and flexible demand do different jobs. Adding one universal storage charge to every wind or solar MWh would look precise and be wrong.
Yes, renewables are still supported
The phrase subsidised is doing too much work.
A Contract for Difference is not a blank cheque. A renewable generator receives or pays the difference between its strike price and a market reference price. It protects revenue and transfers market-price risk. That support has economic value even when the generator pays money back.
In Allocation Round 7, published in January and February 2026, the headline 2024-price strike prices were £65.23/MWh for solar, £72.24/MWh for onshore wind, £91.20/MWh for most fixed offshore wind and £89.49/MWh for Scottish fixed offshore wind. Floating offshore wind cleared at £216.49/MWh. The main mature technologies received twenty-year contracts.
Those are contract prices from a competitive allocation round. They should not be substituted into the DESNZ LCOE table as though both numbers measure the same thing.
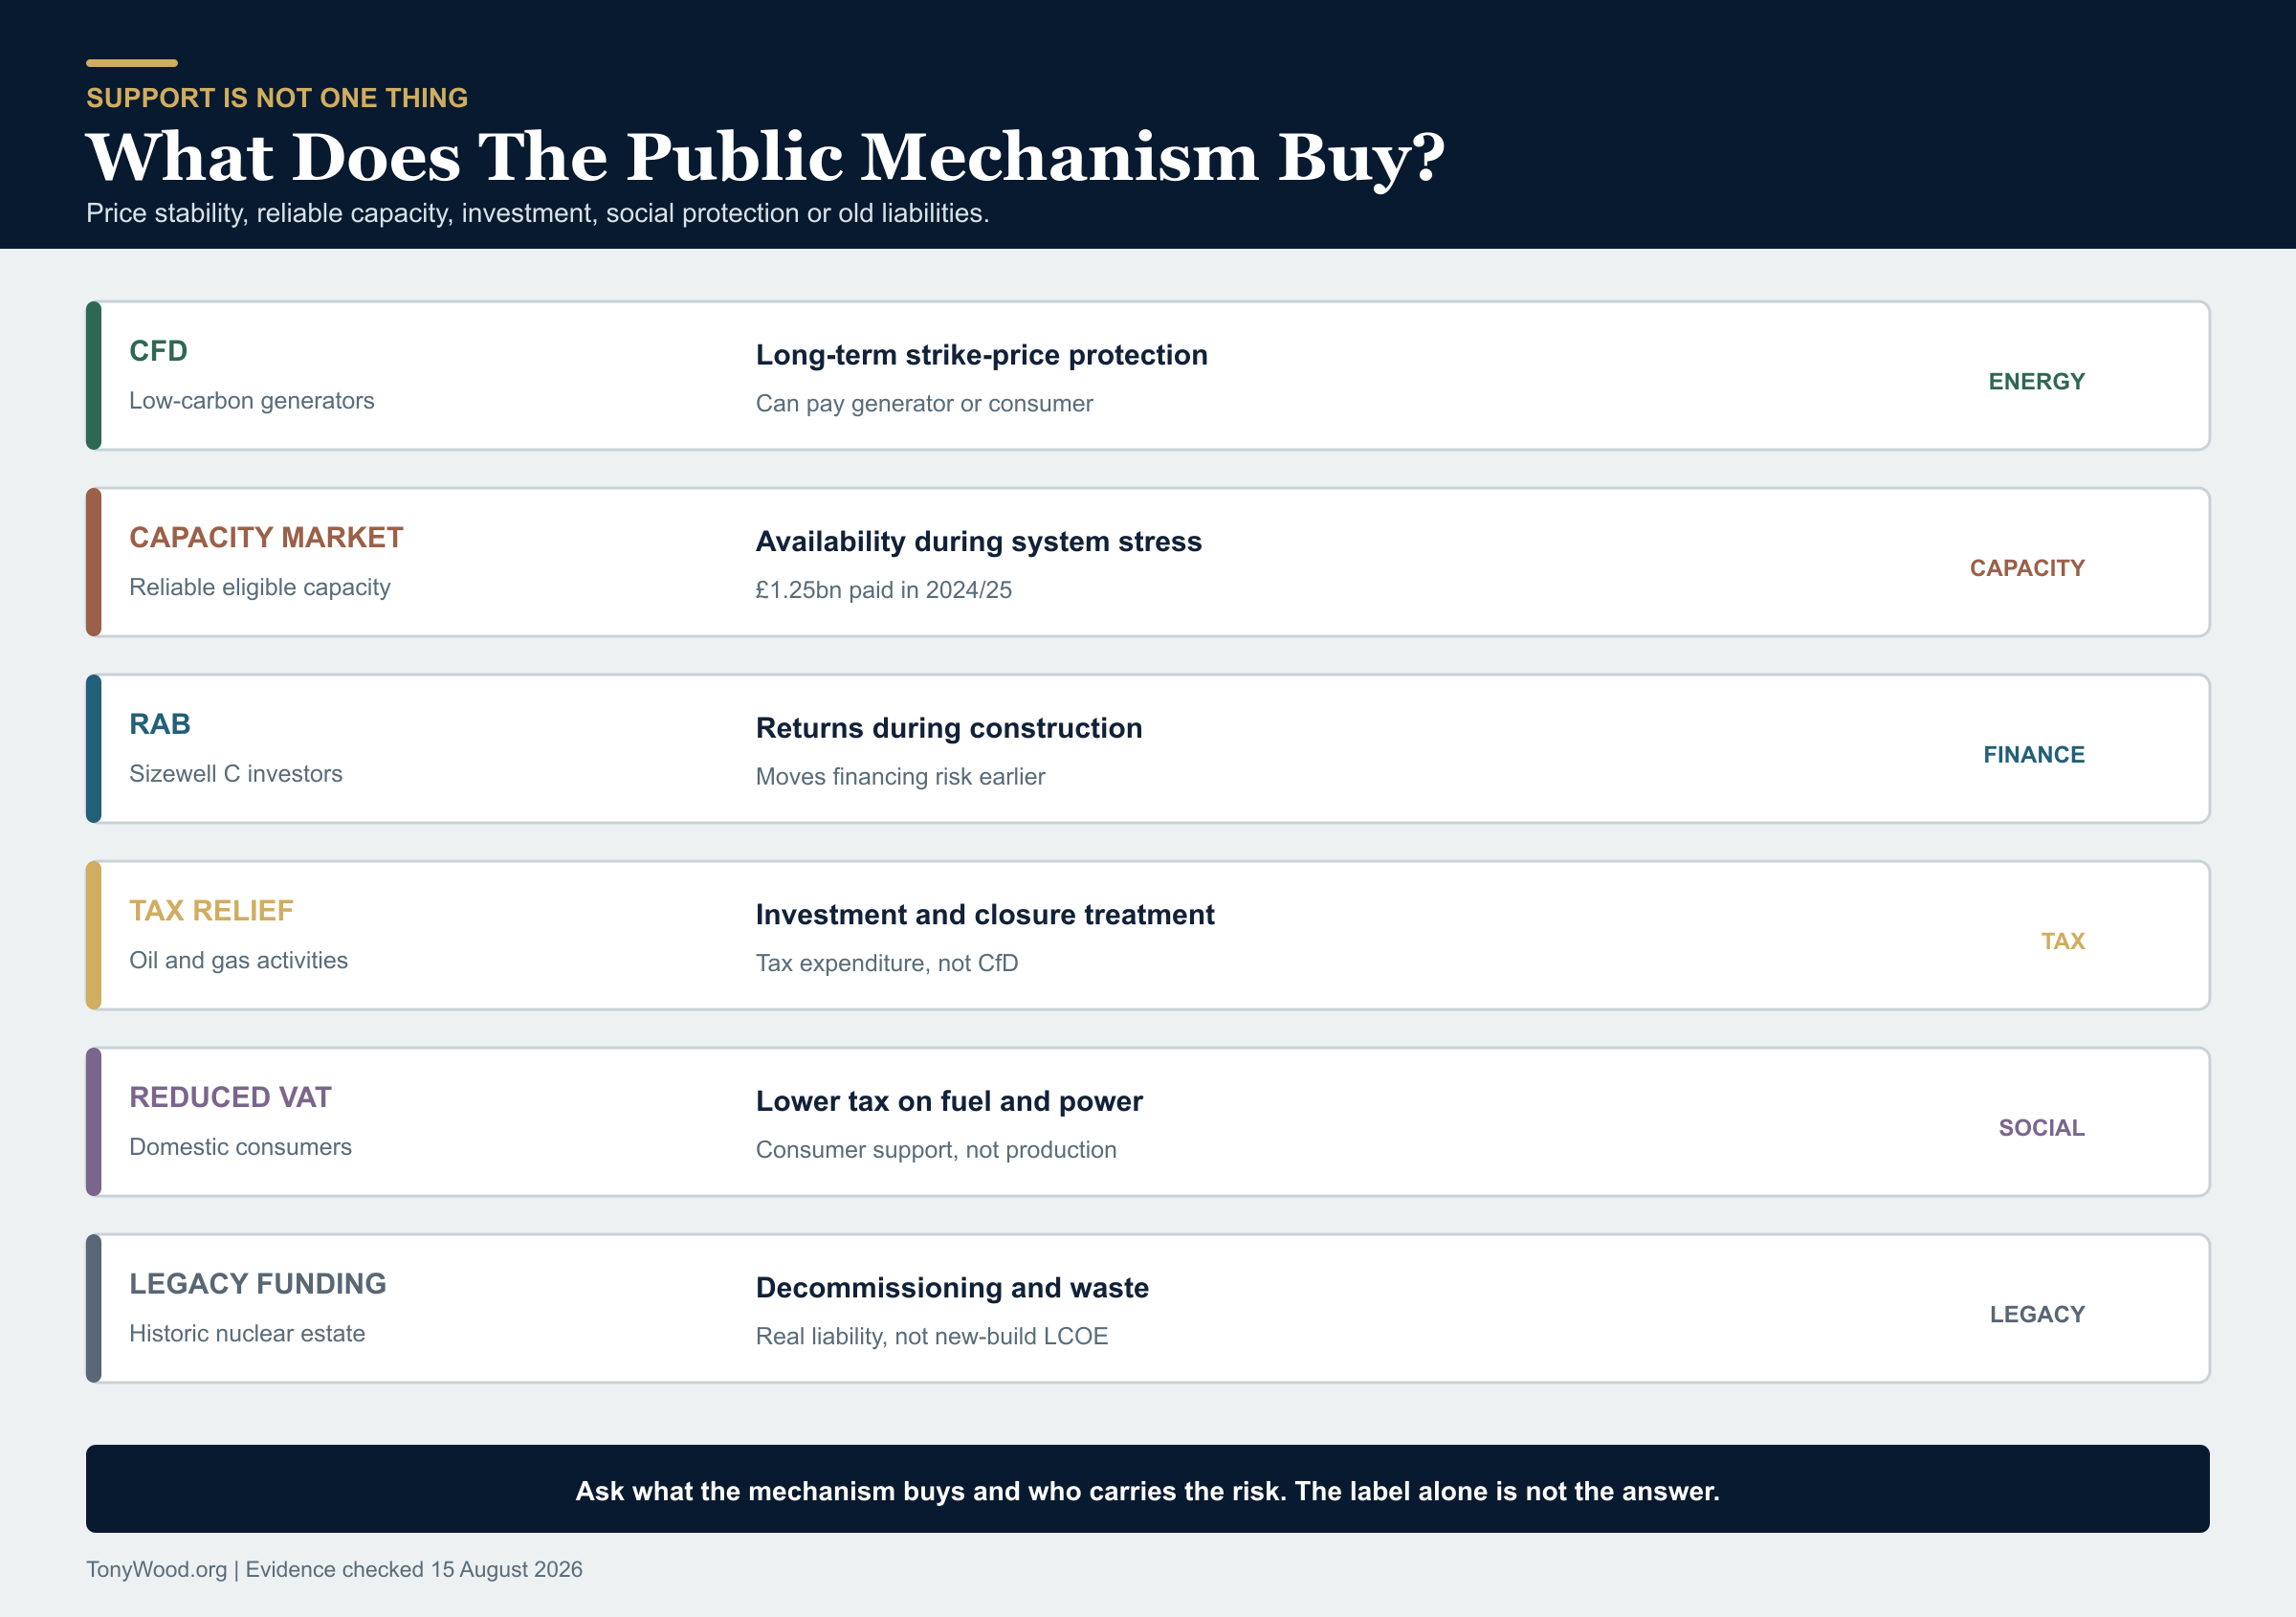
| Mechanism | Main recipients | What it pays or protects | Current evidence | Comparison warning |
|---|---|---|---|---|
| Contracts for Difference | New low-carbon generators | Long-term price certainty relative to a market reference price | AR7 prices include solar £65.23/MWh, onshore £72.24, fixed offshore £91.20 and floating offshore £216.49, in 2024 prices. | A strike price is not a project LCOE or guaranteed net public expenditure. |
| Renewables Obligation | Accredited older renewable generators | Tradeable certificates supplied by generators and required from suppliers | Closed to most new generation but legacy support continues. | Historic portfolio with technology banding; not a new-build auction. |
| Feed-in Tariffs | Accredited small-scale low-carbon generators | Generation and export payments | Closed to new applicants in 2019; existing contracts continue. | Legacy small-scale support, not current utility-scale pricing. |
| Capacity Market | Eligible reliable capacity, including gas, storage, demand response and interconnection | Availability during system stress | £1.25bn paid in 2024/25; technology-neutral subject to eligibility and emissions rules. | It buys capacity, not ordinary MWh, and is not exclusively fossil support. |
| Hinkley Point C CfD | One nuclear project | Long-duration inflation-linked revenue protection | LCCC register showed £130.79/MWh indexed current strike price from April 2026; 35-year term. | Contract revenue proxy, not a current generic nuclear LCOE. |
| Sizewell C regulated asset base | One nuclear project | Consumer-funded returns during construction plus public and private capital | Around £38bn target construction cost in 2024 prices; average bill impact described as about £1/month during construction. | Moves some financing and construction risk before electricity is produced. |
| Oil and gas capital allowances | Ring-fence oil and gas producers | Immediate or enhanced tax deduction for qualifying investment | Official 2025/26 forecast tax expenditure: about £1.7bn. | Tax expenditure, not a generation contract. |
| Oil and gas decommissioning relief | Producers with qualifying liabilities | Relief based on the tax treatment of earlier production profits and decommissioning duties | Official 2025/26 forecast: about £1.0bn, plus around £350m of Petroleum Revenue Tax decommissioning relief. | Includes the cost of closing old assets; the counterfactual matters. |
| Domestic fuel and power reduced VAT | Households consuming electricity, gas and other domestic fuels | 5% rather than standard-rate VAT | Official 2025/26 forecast tax expenditure: about £7bn. | Consumer support across fuels, not a fossil-production subsidy. |
| Legacy nuclear management | Nuclear Decommissioning Authority estate | Decommissioning and waste from historic civil and military programmes | The NDA business plan set £4.164bn expenditure in 2025/26, with £3.305bn government funded. | Not the LCOE of a new nuclear station, but a real public legacy cost. |
The Office for Budget Responsibility forecast environmental-levy receipts at £14 billion in 2025/26, rising to £18.6 billion in 2030/31. That category is wider than renewable generation. These are levy receipts, most of which are directly offset by related scheme spending across social measures, the Capacity Market, CfDs and expected nuclear arrangements. It is not a clean annual subtotal that can be placed opposite the oil-and-gas tax table.
So the accurate sentence is: Britain supports all the major categories examined here, but through different mechanisms for different purposes.
The useful debate is whether each mechanism buys a service worth its cost, allocates risk sensibly and remains transparent. Merely finding a number with the word subsidy beside it does not settle that question.
Nuclear: construction and finance are the story
Current UK nuclear cannot be squeezed honestly into the generic 2030 LCOE table.
Nuclear's attraction is real. Once operating, a reactor can provide large amounts of firm, low-carbon electricity through day, night and changing weather for decades. That is not the same service as variable solar or wind. It is also not perfectly constant: refuelling, maintenance, faults and fleet-wide technical problems still remove capacity.
Hinkley Point C has two 1.63 GW European Pressurised Reactors, 3.26 GW in total. EDF's 2025 results put its estimated completion cost at £35 billion in 2015 sterling, excluding interim interest and foreign exchange, with Unit 1 targeted for 2030. A further twelve-month delay was described as adding about £1 billion.
Sizewell C is intended as a close replica. The UK final investment decision described a target construction cost of around £38 billion in 2024 prices for 3.2 GW and said this represented about a 20% saving against Hinkley. Its regulated-asset-base model lets investors earn during construction, reducing financing cost but exposing consumers earlier.
Both UK EPR projects have a design life of roughly sixty years. That long life matters, but it does not make construction overruns disappear. A sixty-year output stream is only valuable once the plant is finished.
France gives us two different nuclear answers
France is useful because it shows why existing-fleet economics and new-build economics must not be merged.
| Evidence | Published cost | What is inside | What it tells us | What it cannot tell us |
|---|---|---|---|---|
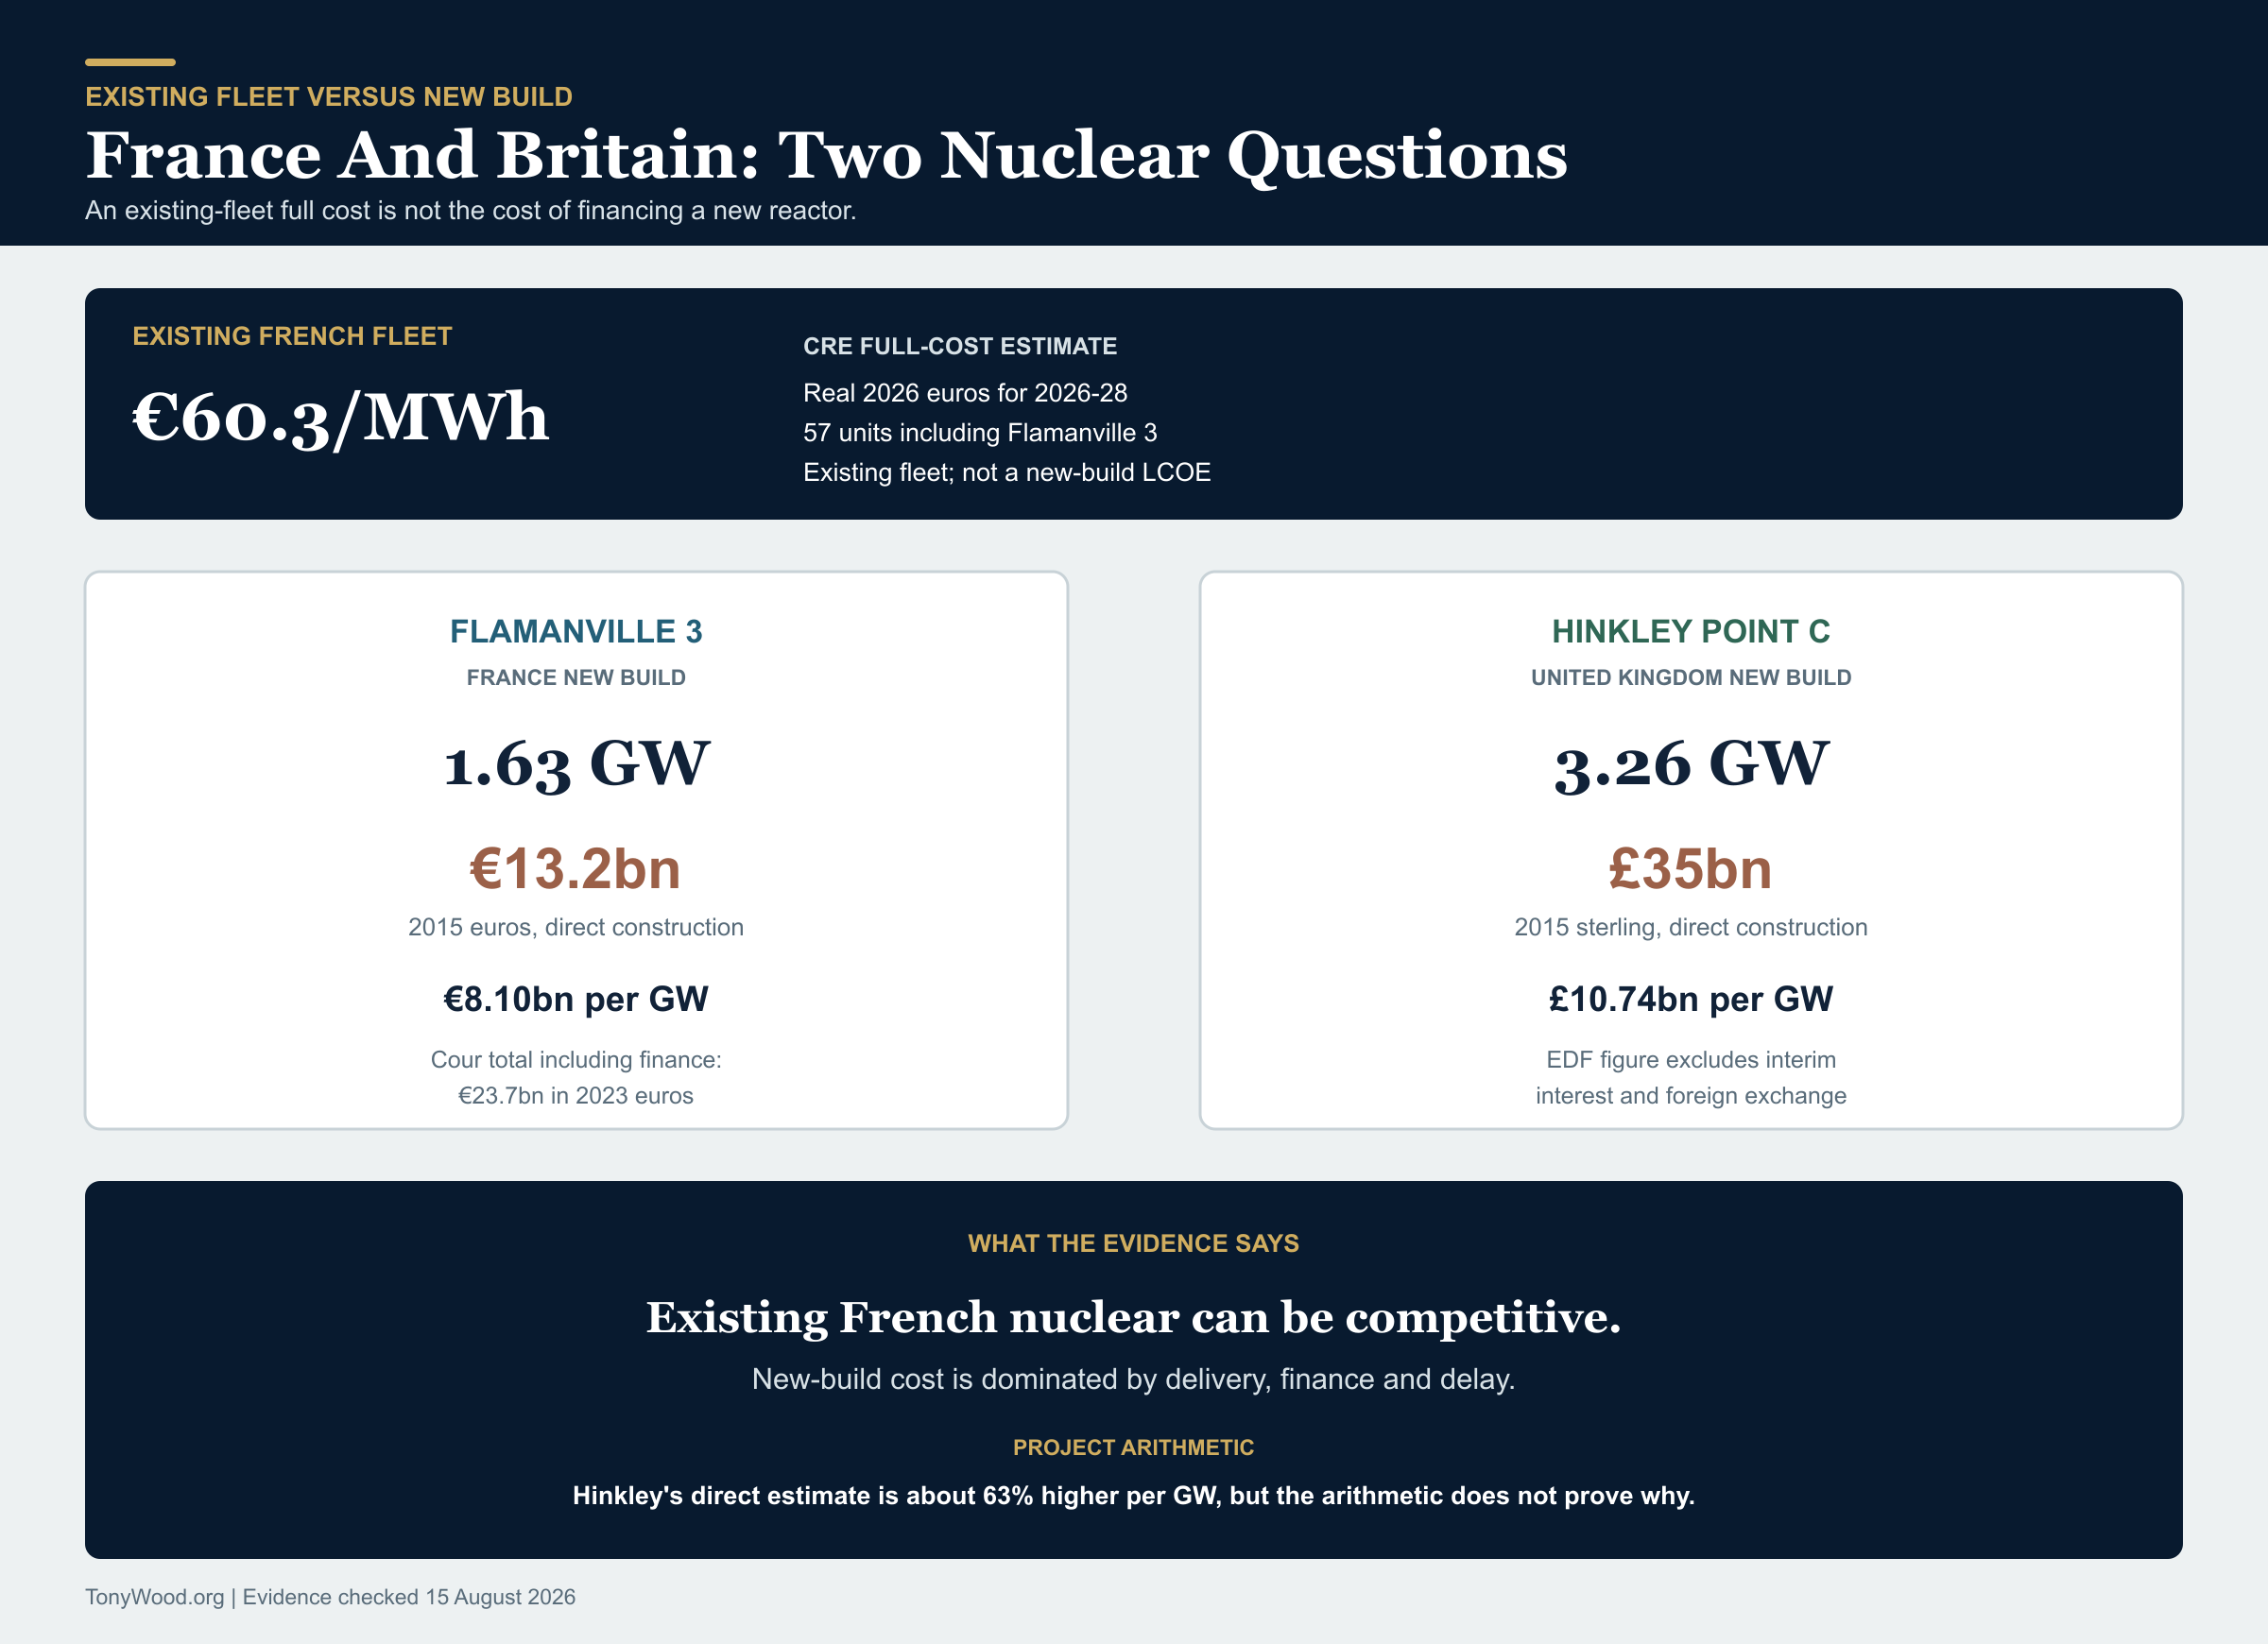
| EDF's existing French nuclear fleet, CRE 2026 to 2028 assessment | EUR 60.3/MWh in real 2026 euros; EUR 61.5/MWh in current euros | Full cost for 57 operating units, including operating charges, depreciation, return on capital and stocks. The regulatory scope includes Flamanville 3 but excludes future EPR2 units. | An established, largely amortised nuclear fleet can deliver firm low-carbon electricity at a competitive full cost. | The price of financing and building a new reactor from scratch. |
| Flamanville 3 new-build project, Cour des comptes | EUR 13.2bn direct construction in 2015 euros; EUR 23.7bn total completion cost in 2023 euros including financing | A first EPR project completed roughly twelve years late, with construction and financing boundaries reported separately. | New nuclear economics are dominated by delivery time, capital and financing. | A settled standalone cost per MWh from mature operations. The reactor only entered the fleet at the end of 2024. |
| Hinkley Point C, EDF and LCCC | GBP 35bn direct completion estimate in 2015 sterling, excluding interim interest and foreign exchange; indexed CfD strike price GBP 130.79/MWh from April 2026 | A two-reactor UK project still under construction and a 35-year revenue contract. | The UK has chosen long-lived firm power, but construction and financing risk are central to what consumers ultimately pay. | An observed operating cost. Hinkley is not yet producing electricity. |
The EUR 60.3/MWh French number is the strongest answer to "what can an established nuclear fleet cost to run and sustain?" It is not the answer to "what will the next nuclear station cost to build?" For that, Flamanville and Hinkley are the uncomfortable evidence.
France versus Britain: the construction comparison
The question I wanted answered was whether British building regulation makes an EPR a known percentage more expensive than the French version.
Here is what can be calculated.
| Project | Capacity | Published direct construction estimate | Direct cost per GW | Design life | Financing boundary | Schedule evidence |
|---|---|---|---|---|---|---|
| Flamanville 3, France | 1.63 GW | €13.2bn in 2015 euros | €8.10bn/GW | At least 60 years in the Cour audit's operating assumption | Excludes financing; Cour des comptes separately estimated €23.7bn in 2023 euros including financing. | About twelve years late in the January 2025 audit. |
| Hinkley Point C, UK | 3.26 GW | £35bn in 2015 sterling | £10.74bn/GW | 60-year design life | EDF says the figure excludes interim interest and foreign exchange. | Unit 1 targeted for 2030 in EDF's 2025 results. |
If the 2015 direct figures are converted using the £1 to €1.23 reference in EDF's Hinkley update, Hinkley's published direct construction estimate is roughly 63% higher per GW than Flamanville's.
That is a rough project comparison, not a 63% British-regulation penalty.
The projects differ in number of reactors, site, labour, supply chain, programme sequence, currencies, contracting, reporting boundary and build period. Flamanville itself suffered severe delay and cost escalation. Hinkley's financing-inclusive cost is not published on a directly comparable basis.
Most importantly, the UK Office for Nuclear Regulation says there were a small number of significant modifications to adapt the Flamanville reference design to UK regulations, but it does not recognise its requirements as the principal factor in Hinkley's additional steel and concrete because the requirements are broadly similar to France.
The government's 2026 response to the Nuclear Regulatory Review does say that better coordination, design replication and proportionate environmental permitting could avoid months and hundreds of millions of pounds. That supports reform. It does not establish the much larger percentage claim.
The evidence-backed conclusion is: Britain's nuclear delivery system has avoidable regulatory and coordination cost, but no credible public evidence isolates a fixed percentage caused by building regulations.
Coal, biomass, hydro, tidal and storage
A complete table should not create fake comparability simply to avoid an empty cell.
| Technology | Useful public evidence | Cost boundary | What can be concluded |
|---|---|---|---|
| Coal | Great Britain's last coal station closed in 2024. | No credible current new-build UK benchmark. | Historic operating and support data can inform legacy analysis, but coal is not a normal 2030 investment option. |
| Biomass conversion | Existing large plants have received Renewables Obligation support and can provide dispatchable output. | Fuel sustainability, imported supply chains, counterfactual land use and legacy conversion matter. | Do not call biomass simply renewable without stating the feedstock and lifecycle assumptions. |
| Hydro | Long-lived existing sites can be valuable and low operating cost. | Site-specific civil works dominate; Britain has limited undeveloped large-hydro geography. | Existing assets are not evidence for the price of a hypothetical new national programme. |
| Tidal stream | DESNZ 2030 first-of-a-kind central LCOE: £288/MWh. | Early commercial deployment with high construction cost and limited evidence. | Current support is buying learning and potential future cost reduction, not today's cheapest bulk MWh. |
| Short-duration batteries | Project economics depend on energy duration, cycle rate, charging cost and multiple market revenues. | Storage consumes and returns electricity; it is not a primary generator. | Use levelised cost of storage only with a clearly specified duty cycle. |
| Long-duration storage | Pumped storage, compressed air, flow batteries and other designs provide different durations and services. | Site, power, energy capacity and financing vary radically. | No universal £/MWh adder belongs on every renewable project. |
The refinery argument is not what it first appears
The claim that Britain exports North Sea oil because it cannot refine oil is wrong in that form.
The 2025 Statutory Security of Supply Report says the UK produced 30.4 million tonnes of crude oil and natural-gas liquids in 2024. Nearly 90% of crude production was exported. UK refineries nevertheless produced 50.8 million tonnes of petroleum products.
Refineries took only 4.0 million tonnes of domestic crude, 7.7% of their demand. The official explanation includes market prices, the increasing sulphur content of domestic crude, refinery configuration and tighter shipping-fuel sulphur rules. Refineries import crude that suits the products and equipment they have; the UK also exports products for which it has a surplus.
In 2024, UK refiners made about 25% more petrol than domestic demand but met only 54.9% of road-diesel demand and 28.8% of jet-fuel demand. The UK was a net importer of refined products by 13.0 million tonnes.
Could Britain build another refinery? Technically, yes. The economic question is whether decades of future demand, margins, product mix, carbon policy and competition from larger modern refineries would repay it.
Grangemouth is a warning against assuming that domestic crude automatically creates a viable domestic refinery. The government said its owners had invested about $1.2 billion since 2011 while the site accumulated more than $775 million of losses, under pressure from larger modern overseas refineries. It became an import terminal.
So the honest answer is not "we cannot refine it". It is: we can refine oil, but crude type, refinery design, product demand and international economics determine what is imported and exported.
What does the evidence actually support?
For new bulk annual electricity in the official 2030 plant model, onshore wind and large solar are cheapest. Their construction is not free: the reference projects require about £67 million and £26 million respectively in direct build cost before finance and their wider project assumptions.
Fixed offshore wind is more expensive at plant level, with a reference direct build of about £3.24 billion, but it is modelled to produce more electricity per installed MW than solar or onshore wind and can use a different resource profile.
Gas remains valuable because it is controllable. The same feature makes the headline cost slippery. A frequently used gas plant can spread its build cost; a rarely used insurance plant cannot. Fuel and carbon remain costs for every MWh it produces.
Nuclear can deliver firm low-carbon power over a very long life. France's existing fleet shows that this service can be competitive once a large fleet is built and operating. In Britain today, however, the decisive new-build issues are construction execution, financing and risk allocation. A contract strike price is not a generic nuclear cost, an old fleet is not a new reactor, and the France comparison does not prove a neat regulation percentage.
Renewables are still supported. Fossil fuels and consumers also receive support. Nuclear uses its own project contracts, public capital and risk arrangements. The fact that support exists is less informative than what service it purchases and who carries the risk when the assumptions fail.
Networks, balancing and capacity are real costs. But they belong to a changing portfolio, not to a simplistic surcharge pasted onto whichever technology somebody dislikes.
The questions I will ask next time
- Is this an existing plant or a new one?
- What year and price base does the number use?
- Does it include the full construction cost and financing during construction?
- What operating life and utilisation are assumed?
- Is it an LCOE, a market price, a contract strike price or a consumer levy?
- What service is being purchased: energy, capacity, flexibility, inertia, location or insurance?
- Which grid and balancing costs are inside the boundary?
- Which costs are being counted twice?
- What support or risk guarantee applies, and who pays when the project goes wrong?
- Is the comparison measured, modelled, contracted or merely asserted?
The phrase the true cost suggests there is one number waiting to be discovered.
There is not.
There is a set of costs, services, risks and time horizons that must be made visible before a comparison becomes meaningful.
That is less satisfying than declaring a winner in a podcast. It is much more useful if we are actually going to build an electricity system.
Related reading
- Why UK Energy Bills Are Still Higher Than Before The Crisis
- Renewable Energy Is Not Material-Free
- UK Data Centre Water And Power: The Facts
- Why The UK Needs More Data Centres
Sources and method
- DESNZ: Electricity Generation Costs 2025 and the official assumptions workbook. Source for generic plant LCOE, cost breakdowns, project assumptions, lifetimes and sensitivities. All quoted LCOEs are real 2024 £/MWh.
- Arup: Onshore wind and solar cost and technical assumptions. Source for the current-project evidence base, sample, method, ranges and model limitations used to check DESNZ's central result.
- Climate Change Committee: Seventh Carbon Budget. Source for the separate CCC and AFRY renewable-cost assumptions and whole-system pathway boundary.
- Lazard LCOE+ 2026. A current private-sector US directional check. Lazard says renewables remain the lowest-cost new build while costs are rising and system diversity remains necessary.
- Fraunhofer ISE: Levelized Cost of Electricity 2024. A German applied-research comparison, used directionally rather than converted into a UK forecast.
- National Audit Office: About us, its 2017 CfD auction investigation and its DESNZ 2024/25 accounts audit. Sources for the NAO's independence, auction-design costs and the uncertainty inherent in long-term CfD valuations.
- Savelli and others, Energy Economics 2022. Peer-reviewed GB modelling showing that congestion and reserve effects depend on technology and location.
- Gordon Hughes / Renewable Energy Foundation: Wind Power Economics and REF's own description of its purpose. Included as an openly sceptical company-accounts challenge, with its age, advocacy position and non-peer-reviewed status made explicit.
- NESO: Annual Balancing Costs Report 2025. Source for £2.7bn total balancing cost, £1.7bn thermal constraints, action volumes, bill share and the 2030 avoided-cost statement.
- NESO: Beyond 2030. Source for the proposed £58bn of further direct network investment.
- Ofgem: RIIO-3 final determinations overview and ED2 price control. Source for transmission and distribution investment boundaries.
- DESNZ: CfD Allocation Round 7 results. Source for current contract strike prices and awarded capacities.
- OBR: Economic and fiscal outlook, November 2025. Source for environmental-levy forecasts and their changing composition.
- UK fossil fuel incentives and subsidies inventory. Source for definitions and forecast tax expenditures. Figures are not added to generation-contract totals.
- Statutory Security of Supply Report 2025. Source for the Capacity Market and UK crude, refining, product-demand and trade evidence.
- LCCC Hinkley Point C contract register, EDF 2025 annual results and the Sizewell C final investment decision. These are project and contract figures, not generic nuclear LCOE.
- EDF: Hinkley Point C update and EDF Energy: nuclear new-build projects. Sources for the project exchange-rate boundary and the UK EPR design life.
- Cour des comptes: EPR sector and Flamanville 3, January 2025. Source for French direct and financing-inclusive project estimates.
- Commission de regulation de l'energie: full cost of France's historical nuclear fleet, 2026 to 2028. Source for EUR 60.3/MWh in real 2026 euros, the 57-unit scope and the cost boundary.
- Office for Nuclear Regulation: Hinkley Point C project update and government response to the Nuclear Regulatory Review. Sources for the limited UK-design-change evidence and the case for reform.
- Nuclear Decommissioning Authority Business Plan 2025 to 2028. Source for the 2025/26 legacy-estate expenditure and government-funding figures.
- UK and Scottish governments: Grangemouth industrial future plan. Source for the recent refinery economics and transition context.
Method note: Derived construction totals multiply the official reference capacity by official real-2024 £/kW assumptions. Derived output multiplies one installed MW by 8,760 hours, the official net load factor and the official operating life. Totals are rounded. No derived system-cost adder or all-in technology ranking is published because the public evidence does not support a stable allocation.
This is public-information commentary, not investment, engineering or policy advice.