
I keep seeing people being quite negative about AI. Then I look at what is happening elsewhere and wonder: are we all looking at the same thing?
A Gallup chart caught my attention. In China, 93% of people who were aware of AI expected it mostly to help their country. In Vietnam, it was 91%. In the United States, 36%.
That is quite a difference. So I wanted to get behind the picture. Were the positive countries actually using AI? Did they trust it? And what, if anything, should we in Britain learn from them?
My takeaway: we should be more curious about the opportunity, but we should not confuse enthusiasm with experience, or experience with trust.
First, what does the chart actually measure?
The Microsoft-Gallup release of 22 September 2026 covers the first 37 countries in a study intended to reach 140. It is an early snapshot, not a finished world ranking. People expecting national benefits outnumbered those expecting harm in 29 of those 37 countries; an outright majority expected benefits in 18.
Those are different claims. More optimists than pessimists does not necessarily mean most people are optimistic.
| Measure | What it tells us | What it does not tell us |
|---|---|---|
| Optimism | Whether someone expects AI to help their country or improve their own life. | Whether they have used it or already benefited. |
| Adoption | Whether someone reports using AI, and how often. | Whether the work is useful, accurate or profitable. |
| Confidence | Here, trust in the accuracy of AI information. | Whether a particular answer is correct, or whether AI companies deserve trust with your data. |
I could use AI every day, check every answer and worry about what my employer intends to do with it. There is nothing contradictory about that.
Put the expectations beside the use
I took the countries that stood out in the supplied chart and compared them with Gallup's published usage data. I added the UK because that is where I live and work.
Read the column headings carefully. Expected benefit is measured among AI-aware adults. Usage is measured across all adults in the survey. We cannot subtract one from the other and call the result a confidence gap.
| Country | Expect national benefit AI-aware adults | Ever used AI All adults | Use daily All adults |
|---|---|---|---|
| China | 93% | 70% | 36% |
| Vietnam | 91% | 43% | 12% |
| Singapore | 77% | 79% | 46% |
| Israel | 69% | 63% | 37% |
| Nigeria | 68% | 20% | 9% |
| United States | 36% | 68% | 23% |
| United Kingdom | Not shown* | 64% | 29% |
| Malawi | 35% | 3% | 1% |
Sources: Gallup's expected-impact chart and usage chart. Ever used is calculated by adding daily, weekly and monthly-or-less usage before rounding. *The expected-impact chart publishes only the top and bottom five countries, not a UK figure. This is a selected comparison, not a new ranking. Daily use can be for personal reasons, work or both.
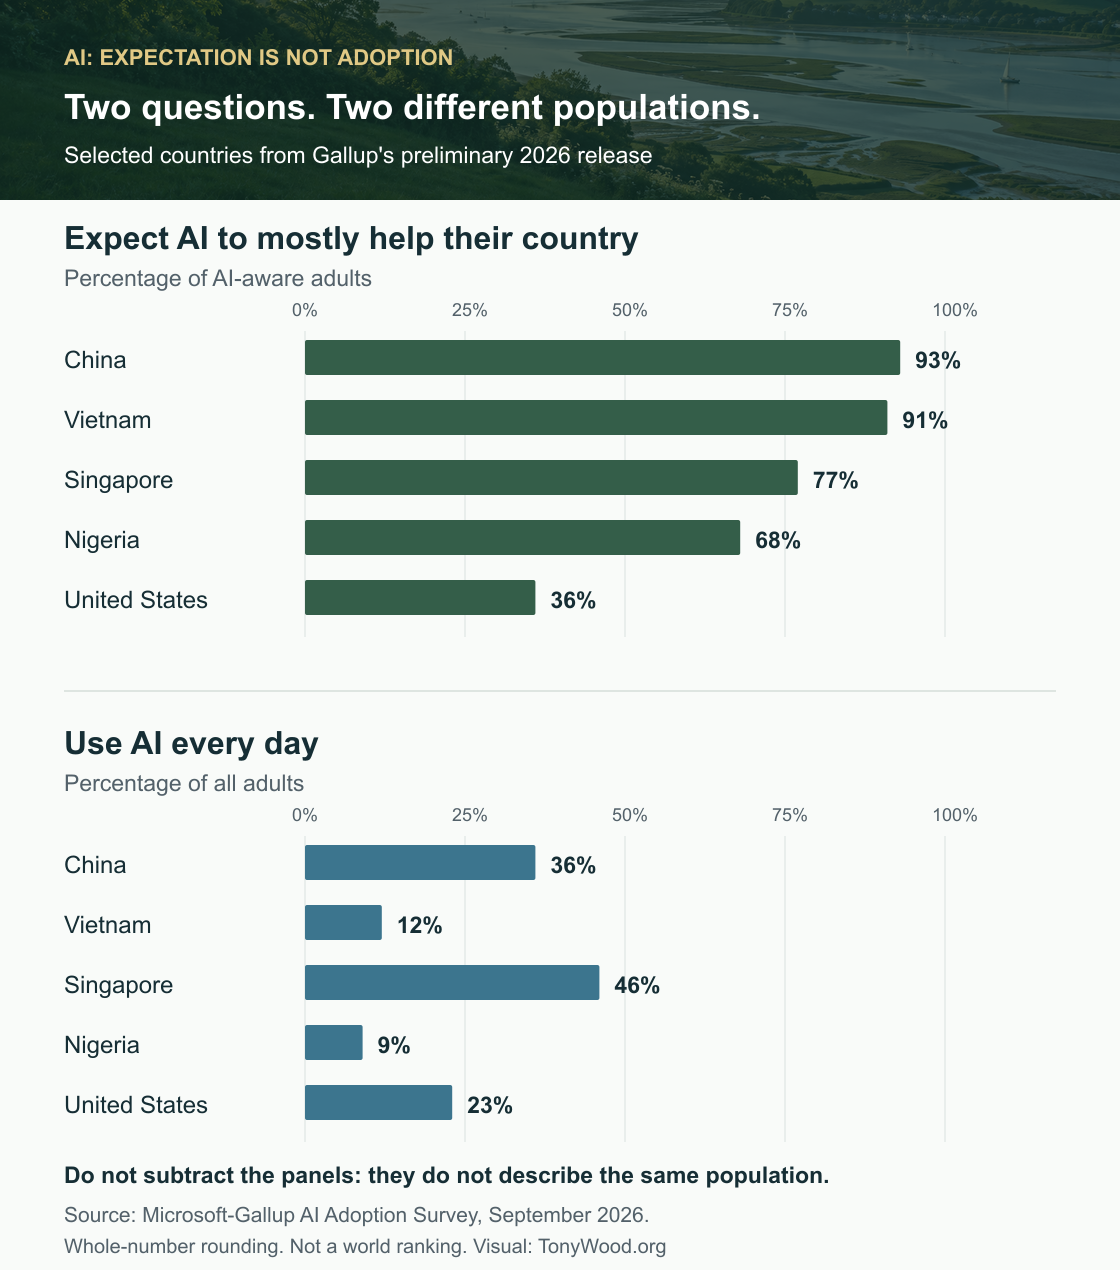
Singapore is an example where substantial use sits alongside optimism. Vietnam is striking for its expectations, but it would be wrong to describe it as having the same daily adoption as Singapore.
Nigeria is particularly interesting. The positive view belongs to the people who know about AI, not automatically to everyone in the country. To me, that raises a practical question: what would help more people try something useful? Affordable access? Relevant tools? Training? The chart does not identify which barrier matters most.
Then there is America. It is clearly not a case of everybody refusing to touch the technology. Many have tried it. Their expectations for the country are another matter.
And Malawi prevents us telling a convenient story in which every lower-income country must be more enthusiastic. The picture is not that tidy.
Britain is not simply refusing to use AI
The UK usage figures surprised me. They do not fit a simple story of a country standing outside, arms folded, refusing to get involved.
Nor does that involvement mean everybody is comfortable. In Gallup's trust data, 47% of UK daily users trust AI to provide accurate information completely or a lot, compared with 11% of AI-aware nonusers. Yet its worry data show 57% of daily users still feel worried.
Being familiar with the tool is not the same as being relaxed about the future.
A separate Ipsos survey published in June 2026 found 62% in Great Britain nervous about AI, compared with a 32-country average of 50%. Only 29% were excited. It also found that 50% reported using tools they did not fully trust. In the underlying questionnaire, 74% disagreed that they trusted AI tools enough not to check their work.
I rather like that last instinct. Using something while retaining your judgement is not a failure of adoption. It may be exactly the skill we need.
The Ipsos questions and sample differ from Gallup's, so this is a separate check on the broad pattern, not a number to splice into its table.
Why might people see it so differently?
This is where I would separate the evidence from my interpretation. The surveys show differences. They do not establish one cause for each country's attitude.
First, what does AI look like it might give you? If I imagine help learning a skill, translating a document or getting a small business started, I can see an opportunity. If I imagine my employer using it to remove my job, I can see a threat. The same capability could appear in both stories.
Ipsos offers a related interpretation: the divide may partly be between people seeking change and those protecting what they already have. That is a useful question to explore, not a diagnosis of whole nations. Its 2026 report discusses this alongside expectations about the economy.
Second, whose decisions are you being asked to trust? I might trust an agent to help organise my notes without trusting a company to be fair about redundancies. I might enjoy a translation tool without wanting it to make a consequential decision about my life. Asking whether I am simply for or against AI loses all of that.
Third, what have you actually experienced? A useful result gives you something concrete to judge. So does a confident mistake. My suggestion is to build confidence task by task: show what worked, show what failed, and explain what still needs checking.
We should also ask about language, access, education, public discussion and the conditions in which people answer surveys. But these data do not let me announce that a country's score is caused by its culture, its media or its political system. That would be a much bigger claim than the evidence supports.
More use does not automatically remove the worry
The temptation is to say: just get people using it and they will become positive.
I would be careful with that.
The country comparisons are observations, not an experiment. Perhaps use builds trust. Perhaps people who already trust AI choose to use it more. Age, occupation, access and other differences could influence both.
There is also useful counterevidence. A separate Gallup analysis of US workers found that, in most survey waves from 2023 to early 2026, daily or several-times-weekly workplace users were more than twice as likely as monthly or yearly users to say it was very likely that technology would eliminate their job within five years. Supportive management was associated with less insecurity. That concerns workplace job fears, not the World Poll's general feelings about AI.
Imagine being told to become excellent at using AI while nobody will explain what happens to your role afterwards. A training session alone will not answer that question.
For a leader, the conversation needs to include the work, the people and who benefits. Not just the software licence.
What I would take from this
I do not want Britain to win a competition for blind enthusiasm. Equally, I do not want us to dismiss a useful technology because the loudest conversations around us are negative.
My concern is practical. If we stop at the argument about whether AI is good or bad, we miss the chance to learn where it can help. But if we demand enthusiasm before listening to people's concerns, we make trust harder to earn.
For a business or a team, I would start here:
- Choose a real, bounded problem. Something useful enough to matter and small enough to check.
- Give people access and time to learn. Do not mistake a lack of opportunity for a lack of interest.
- Measure the result, including the checking. Faster drafting is not necessarily faster finished work.
- Talk honestly about the people. Explain what is changing, what is uncertain and how decisions will be made.
- Keep permission to disagree. Someone spotting a failure is helping the project, not spoiling the mood.
The original chart reminded me that the conversations I hear are not the whole world's view. Looking underneath it reminded me of something just as important: confidence is not one thing.
I want us to be confident enough to learn, and demanding enough to make it worthwhile.
Perhaps the most useful question is not, "Why aren't you more positive about AI?" It is, "What would need to happen for you to feel that this is working for you?"
Sources and limits
Research checked on 25 September 2026. This article uses the published charts and aggregate tables, not individual survey responses. It does not establish causes, forecast productivity or measure the quality of a country's AI deployment.
- Gallup's preliminary September release is a Microsoft partnership. Microsoft's commercial interest matters when considering the framing; it does not by itself invalidate the results.
- Gallup's question-development account explains the focus on recognisable generative-AI uses and country-specific examples. It is not a census of every hidden AI system people encounter. People unaware of AI skip the use and attitude questions; emotions are asked separately, so respondents can be both positive and worried.
- Gallup's World Poll methodology targets adults aged 15 and over. The published chart does not show country-specific AI-aware subgroup sizes or uncertainty intervals beside the figures. Small differences should not be treated as decisive ranks.
- The Ipsos AI Monitor surveyed 23,532 people across 32 countries from 20 March to 3 April 2026, principally online. Great Britain's sample was approximately 1,000 people aged 16-74. Its methodology warns that some country samples represent a more connected, urban, educated or affluent population. Its country average is not weighted by countries' population sizes. Great Britain is not identical to the UK.
- A country average is not a description of every person in that country. Nor does this preliminary sample establish what most people on Earth think.
For the practical side of building confidence, see Can I Trust Claude and Codex? and Don't Just Delegate to AI. Work Beside It.