I was reading a piece about multi-agent systems and it kept talking about graphs.
Agent graphs. Task graphs. Knowledge graphs. Memory graphs. Execution graphs.
I sat there thinking: this sounds important, but is there a simple way to understand what any of it means?
Then it clicked.
A useful plain-English way to think about an agentic graph is as a map of the work.
In this picture, the dots stand for the things involved. The lines show possible relationships or transitions between them.
That is the basic idea.
Everything after that is detail.
It is not a universal technical definition. Different graphs and frameworks use nodes and edges in different ways. It is simply the explanation that helped me see what was going on.
Start with dots and lines
In graph language, the dots are usually called nodes. In an agentic workflow, a node might stand for:
- an agent;
- a task;
- a tool;
- a document;
- a piece of memory;
- a decision;
- a human approval; or
- an outcome.
The lines are called edges. In this kind of workflow, an edge might mean:
- send the work here next;
- ask this specialist;
- read this source;
- wait for this task;
- verify this claim;
- return the result; or
- stop and ask a human.
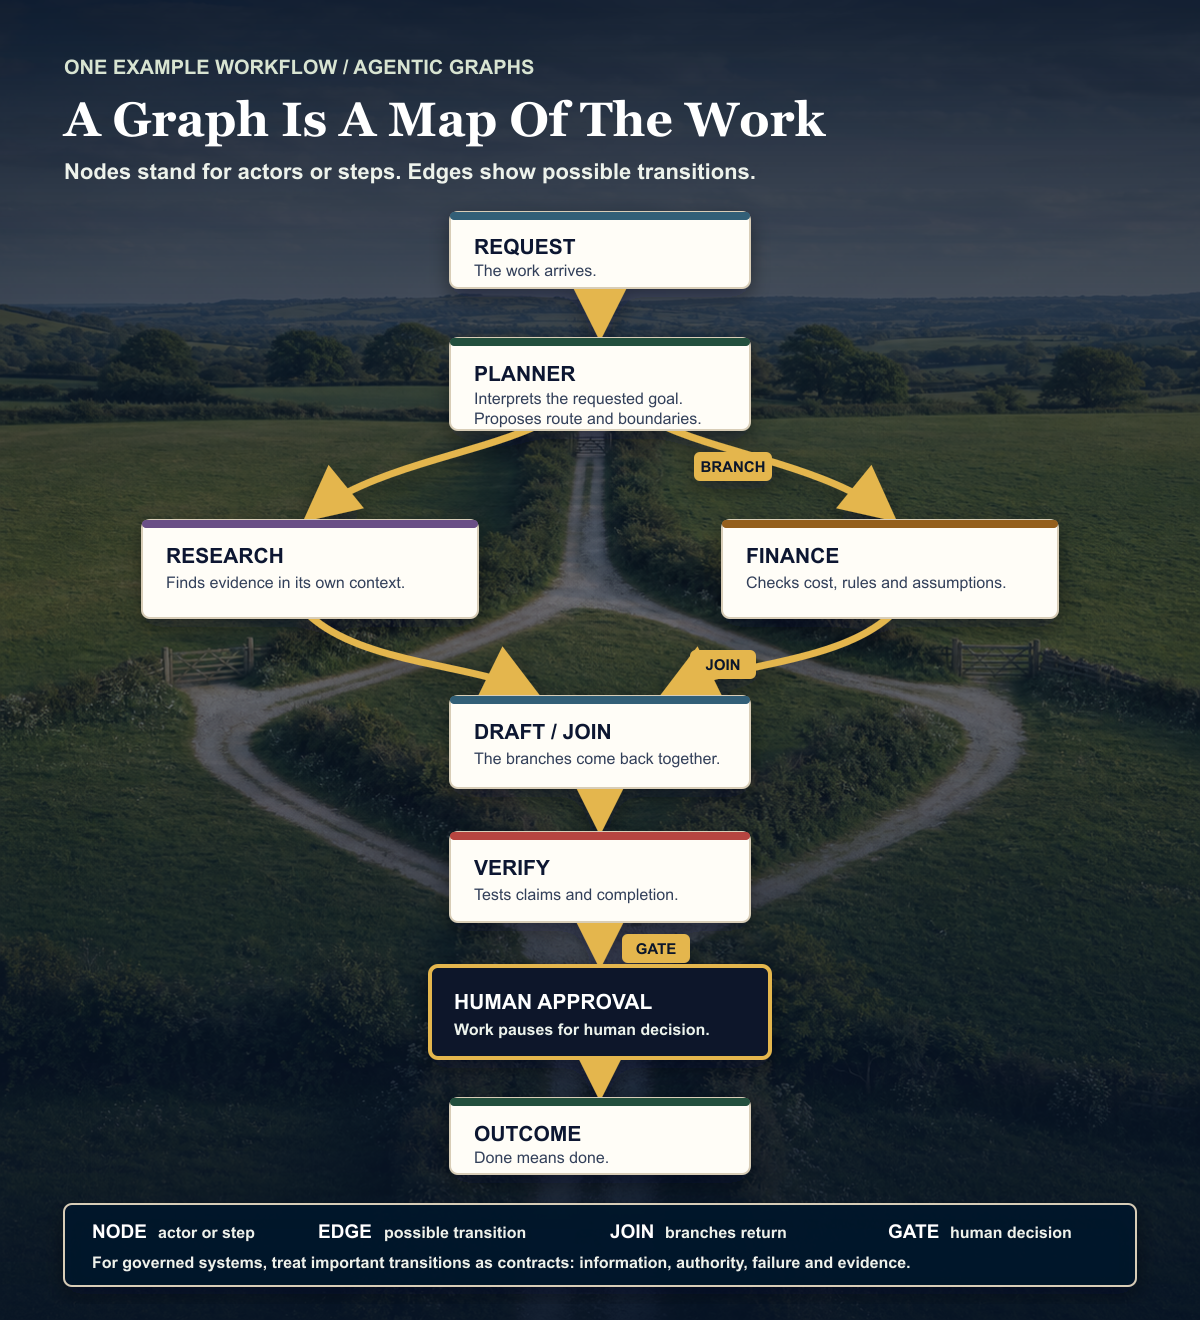
So imagine a piece of work arrives.
A planning agent looks at it. The planner sends one part to a research agent and another part to a finance agent. Their results return to a drafting agent. A verifier checks the draft. A human approves it. Then, and only then, it can become an outcome.
Draw that on a whiteboard and you have a graph.
The graph is not necessarily the system
This was the next useful thing for me.
A graph does not have to be one enormous technical object containing everything.
It can be a particular view of the same system.
The following is my working taxonomy for making those views understandable. It is not an industry standard.
| Graph | The simple question it answers |
|---|---|
| Agent graph | Who can do the work, and who may hand it to whom? |
| Task graph | What has to happen, and what depends on something else? |
| Knowledge graph | What things do we know, and how are they related? |
| Memory graph | What should this system remember, and what is connected to it? |
| Communication graph | Who may speak to whom, using which route? |
| Execution graph | What actually happened during this run? |
These graphs may overlap. They may share the same nodes. They may be stored in completely different ways.
The important point is that each one gives us a map we can inspect.
Why not just use one agent?
Quite often, we should.
If the work is short, mostly sequential, low-risk and fits comfortably inside one context, one well-configured agentic system may be simpler, faster and cheaper.
OpenAI's practical guide recommends starting with a single agent and adding more only when the work or tool selection genuinely becomes too complex. That feels right to me.
That choice is separate from whether the work is represented as a graph. A graph can describe a single-agent workflow too. The reason to make that graph explicit is usually branching, joins, loops, checkpoints or traceability, not merely the number of agents.
A graph starts earning its keep when the work contains real structure:
- several things can happen in parallel;
- different specialists need different instructions or tools;
- one piece of work depends on another;
- results have to come back together;
- the system may need to loop, recover or take another route;
- some transitions require evidence or approval; or
- we need to understand where the system went wrong.
Anthropic describes its research system as an orchestrator with specialist agents working in parallel. It also describes the cost and coordination problem: multi-agent work can consume far more tokens, and tasks with many shared dependencies may be a poor fit.
So more dots do not automatically mean more intelligence.
Sometimes they just mean more meetings.
The edge may be more important than the node
We naturally focus on the nodes.
Which model is the planner? Which agent writes the draft? Which tool does the research?
But I think the really interesting design work sits on the edges.
An edge can say:
- what information may cross;
- what format it must use;
- what evidence must travel with it;
- whether the next node may only read or may also write;
- how much time or money it may spend;
- what happens after a failure;
- how many retries are allowed; and
- whether a human must approve the transition.
For governed systems, I think we should treat each important transition as more than a line.
I treat it as a contract.
Specify what information and authority may cross, the failure rule, and the evidence to retain.
The most important question is not simply, "Can these two agents communicate?"
It is, "What information and authority are allowed to cross this edge?"
Protocols such as A2A can help agents coordinate tasks and exchange messages and artifacts. MCP can connect an AI application to tools and contextual information. But connectivity is not authority. A route existing does not mean every action on that route should be allowed.
The graph makes governance visible
This is where the simple picture becomes operationally useful.
You can place a verifier directly into the graph.
You can place a budget check before an expensive branch.
You can place a privacy check before data leaves one area.
You can place a human approval before an email is sent, money moves, code is deployed or something becomes public.
You can place an eval after the outcome and an audit trail behind the whole run.
You can draw the stop-line.
That is far more useful than hiding all of those decisions inside one giant prompt and hoping everybody remembers how it works.
LangGraph describes graphs through state, nodes and edges, including conditional routes. Microsoft's experimental AutoGen GraphFlow supports sequential, parallel, conditional and looping patterns. The technical implementations differ, but the visual idea is the same: the possible movement of work is explicit.
Execution tracing can add the receipt
There are really two maps.
The first is the design map: what the system is allowed to do.
If the system records the nodes and transitions actually taken, that execution trace becomes a second map: what happened during this run.
Perhaps the research branch ran but the finance branch did not. Perhaps the verifier rejected the first draft. Perhaps the system reached the human gate and stopped. Perhaps it retried a tool three times and then chose another route.
That execution trace matters.
It helps us understand cost, delay, failure, duplicated work and unexpected behaviour. It also gives a human reviewer something more useful than the final answer alone.
The answer tells us what arrived.
The graph can help tell us how it got there.
The smallest useful starting graph
I would not begin with a swarm of 50 agents.
I would begin with something I could draw without running out of whiteboard:
- Request: what has arrived?
- Planner: what outcome is required and what work is actually needed?
- Specialists: which one or two bounded tasks benefit from separate context or tools?
- Join: where do the results come back together?
- Verifier: what evidence shows the work is good enough?
- Human gate: what needs judgement or authority?
- Outcome: what does done mean?
Then I would add four things to every important edge:
- the information allowed to cross;
- the authority allowed to cross;
- the failure and retry rule; and
- the receipt to keep.
That is enough to begin learning.
It is organisational design made visible
I now think the word graph makes the subject sound more mysterious than it needs to be.
We have always drawn organisations as boxes and lines. We draw processes as flows. We draw road maps, dependency maps, family trees and network diagrams.
An agentic graph is the same instinct applied to work done by agents, tools, knowledge, memory and people.
It does not make the agents intelligent.
It makes the relationships understandable.
And once we have more agents than we can comfortably hold in our heads, that map becomes very important.
Because if we cannot see where the work can go, what can travel with it, where it must pause and who remains accountable, we do not really have an agentic organisation.
We have a collection of clever things connected by hope.
Related reading
- Not Every Workflow Is An Agent
- The Goal Is The Interface
- Agentic Architecture Is Layers All The Way Down
- Making Agentic Work Visible
Sources and notes
- OpenAI: A practical guide to building AI agents - agent components, the recommendation to start with one agent, and manager versus handoff orchestration patterns.
- OpenAI Agents SDK: Agent orchestration - manager and handoff patterns for composing agents.
- LangGraph: Graph API overview - the state, node and edge model, including conditional routes.
- Microsoft AutoGen: GraphFlow - experimental directed-graph support for sequential, parallel, conditional and looping agent workflows.
- Anthropic: How we built our multi-agent research system - an orchestrator-worker example, with practical benefits, costs and coordination limits.
- A2A Protocol specification - tasks, messages, artifacts, agent discovery and security concepts for agent-to-agent interoperability.
- Model Context Protocol: Architecture overview - the host, client and server roles used to connect AI applications to tools and contextual information.