This is part one of UK Data Centre Infrastructure. Part two asks why Britain needs more computing capacity and how different workloads should be matched to different places.
Evidence update, 4 September 2026: I have checked Sam Altman's comparison between one California almond and 38,000 ChatGPT queries, then put it beside other familiar foods using the same broad water-footprint method. The quote is genuine and the arithmetic is consistent, but every comparison depends heavily on the accounting boundary.
Evidence update, 30 July 2026: I have updated this article after an external evidence review. The correction makes the limits and partly shared provenance of the datasets clearer, adds the concentration finding from the final WRc report, corrects source labels and records the drought-status change reported after the Environment Agency's 17 to 23 July snapshot.
I have written about AI and water before.
In The Hidden Cost of the Mundane: AI and Water, I was trying to make an invisible resource visible. In AI Data Centres: Water Use in Context, I tried to compare it with things people already understand.
Those were useful starting points. We now have much better UK evidence.
And the more honest answer is neither “data centres are drinking towns dry” nor “it is basically the same as running a leisure centre”.
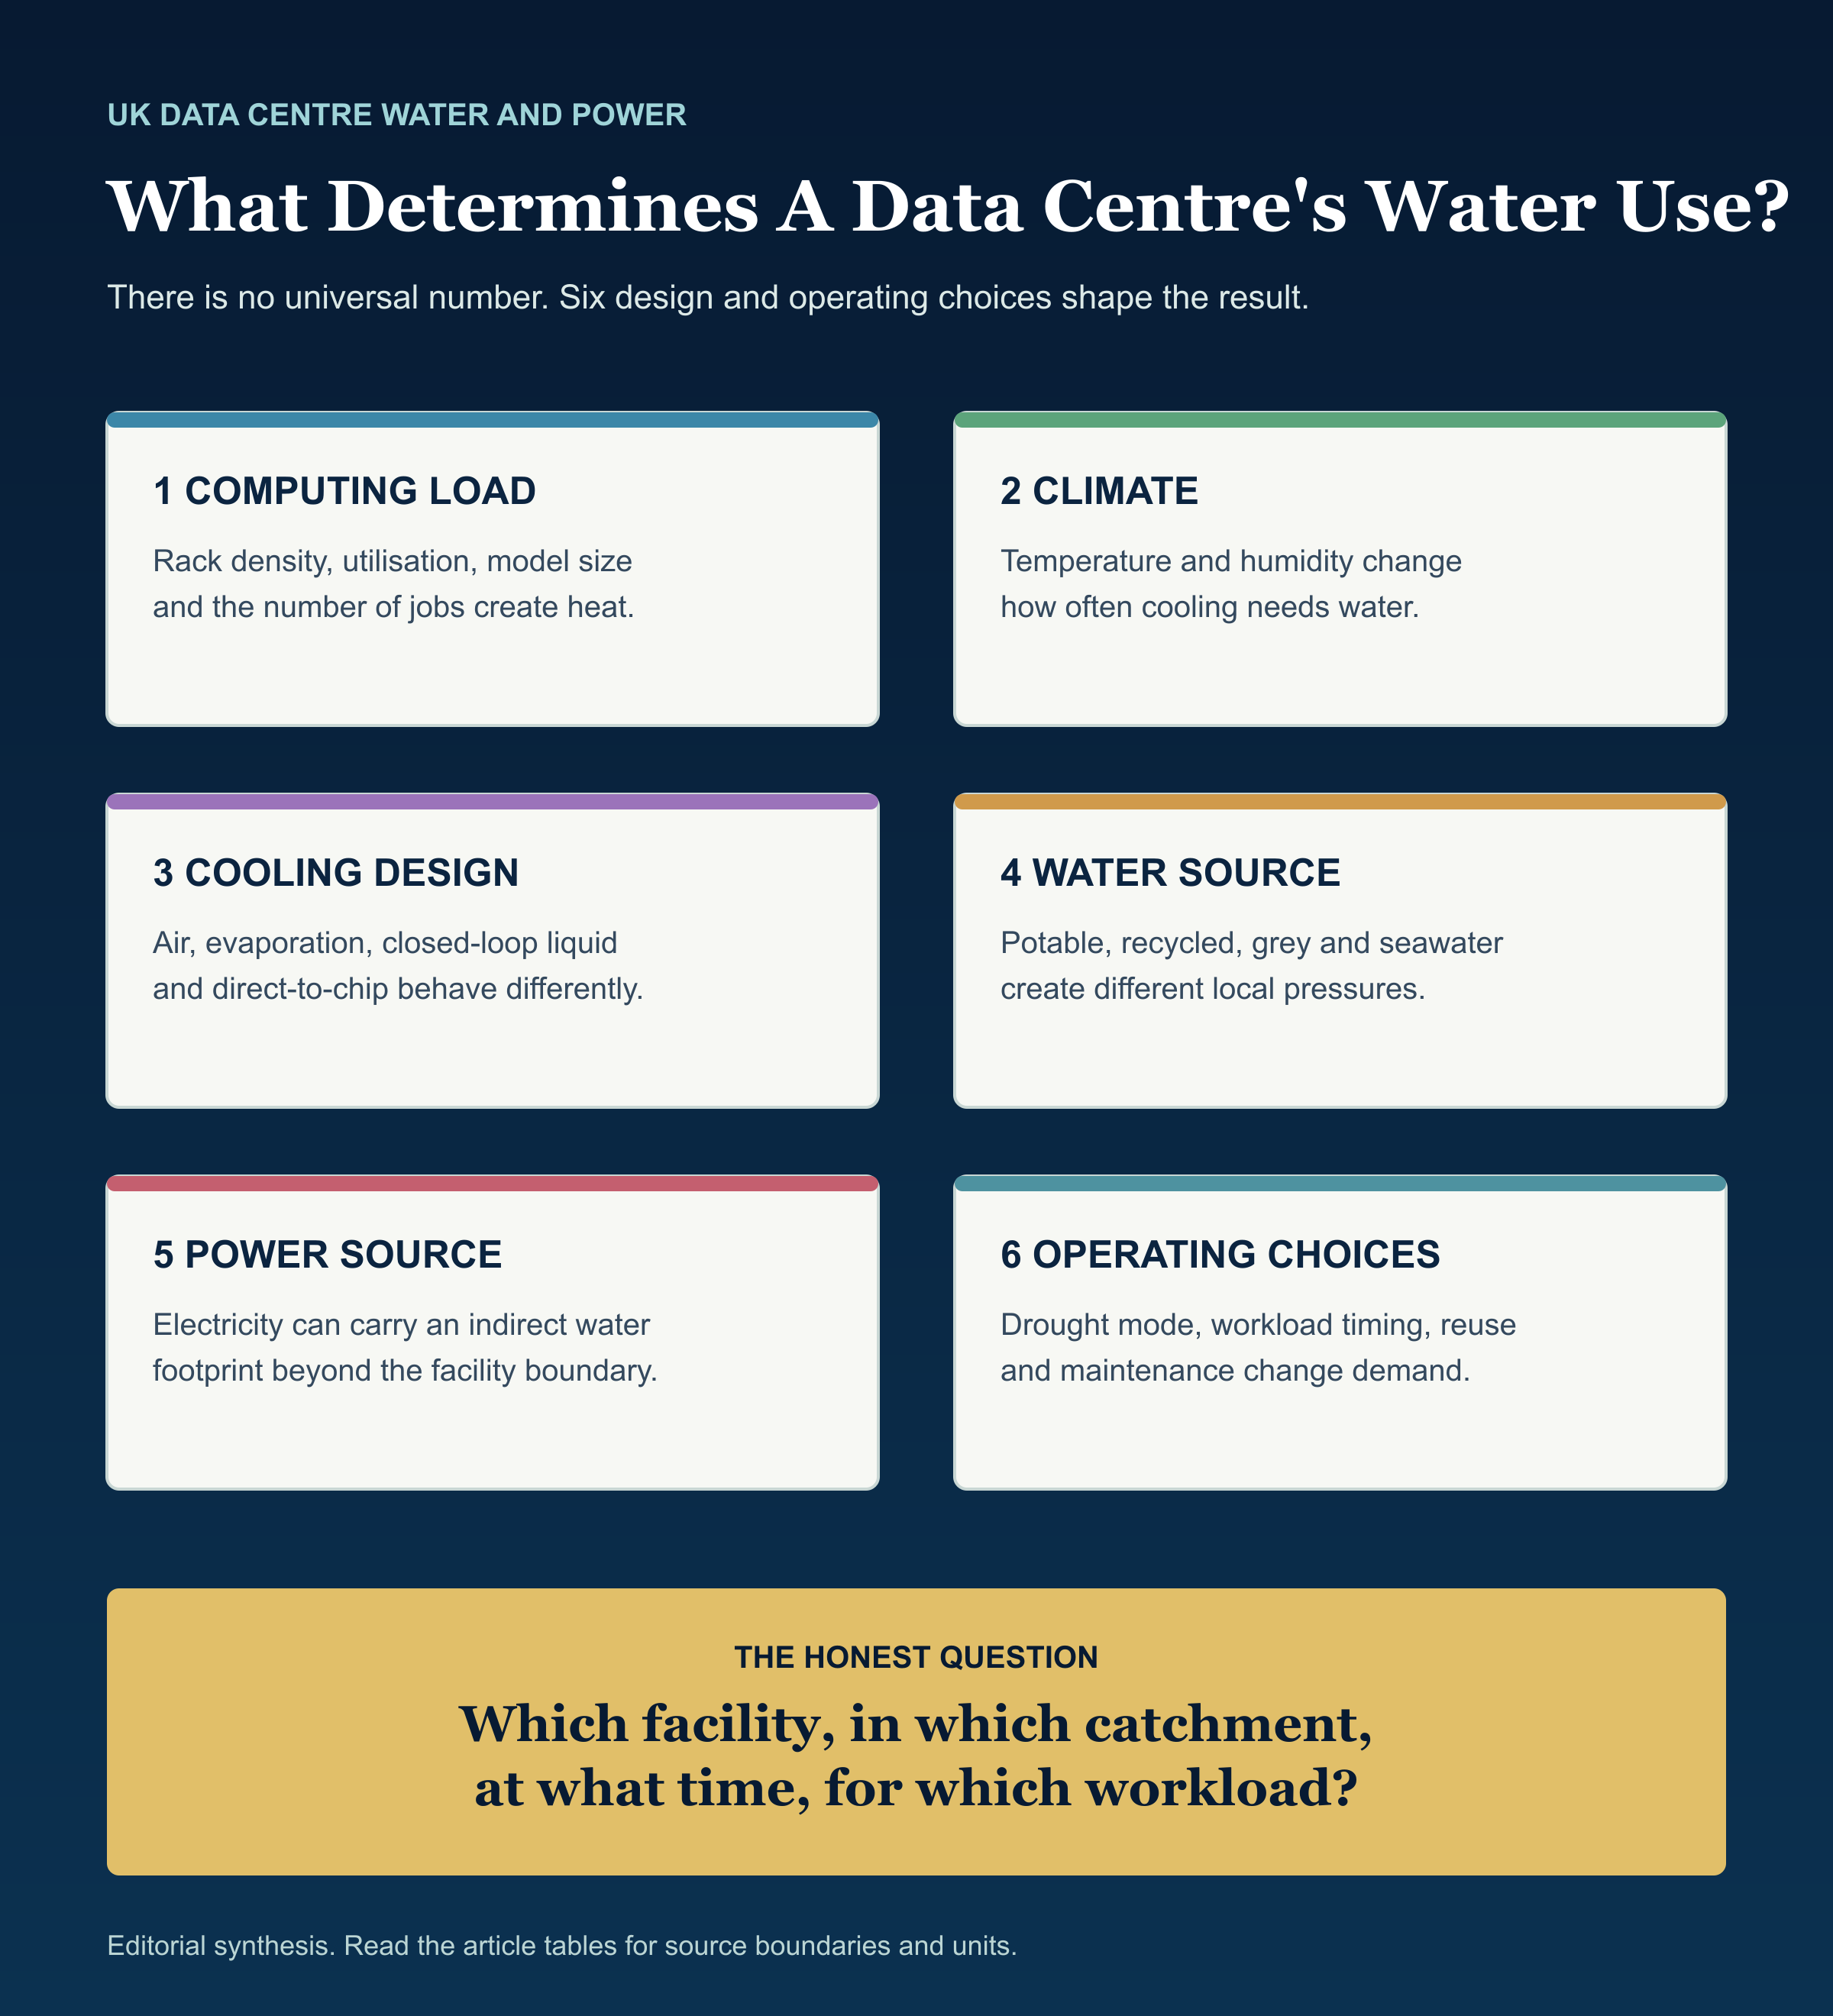
Some data centres use no water for cooling. Some can ask for millions of litres on a hot day. A national annual total can look modest while a single connection request is extremely difficult for one local catchment. A cooling design can save water while using more electricity, or save electricity while increasing evaporative water use.
The real question is not: do data centres use water?
It is: which facility, using which cooling system, in which catchment, at what time, for which workload?
First, what are we measuring?
Water figures become muddled very quickly because people use the same word for different things.
- Withdrawal is water taken from a river, aquifer, public supply or other source.
- Consumption is the part not returned to the same local water system, often because it evaporates.
- Direct water is used at the data-centre site.
- Indirect water can be used elsewhere to generate the electricity that powers it or to manufacture its equipment.
- WUE, or water usage effectiveness, usually describes litres of on-site water per kilowatt-hour of IT energy. It is useful, but it is not the whole water footprint.
We also need to separate potable drinking water from non-potable, recycled, grey or seawater. One litre is still one litre, but the pressure it creates is not the same.
And annual use is not peak use. That distinction matters in a British heatwave, when household demand can rise at exactly the same time that an evaporatively cooled facility needs more water.
What the UK evidence now tells us
The most useful recent evidence comes from MOSL and WRc, techUK, Water UK, the Department for Energy Security and Net Zero, and the Environment Agency. They measure different things, but they are not fully independent: the final WRc study includes the techUK survey run with the Environment Agency among its inputs. The figures should therefore be read as a partly shared evidence base and placed alongside one another, rather than presented as separate confirmation or forced into one false total.
| Evidence | Year and geography | Finding | What it means |
|---|---|---|---|
| MOSL / WRc estimate | England; 2024 meter data, final report published 2026 | 1.879 billion litres of potable public-supply water a year; about 0.2% of the English non-household market. | An extrapolation based on 208 matched water connections, not a complete census or the entire direct and indirect water footprint. |
| techUK survey | 73 English commercial facilities; voluntary survey published 2025 | 51% reported waterless cooling; 64% used less than 10 million litres a year; 89% either measured water or used none. | Useful design evidence, but not a representative census. Participation was voluntary and weighted towards wholesale and colocation operators. |
| Water UK evidence | UK, submitted 2026 | Estimated current average demand of 6.6 million litres a day and peak demand of 14 million litres a day. | An industry extrapolation from a 116-site sample and a scenario base, not a metered census of every site. |
| DESNZ electricity estimate | Great Britain, calendar year 2024 | 4.5 TWh, around 2% of grid electricity consumption; 77% was in London and the South East. | Official Statistics in Development based on meter matching; enterprise data centres are excluded. |
No one dataset is a complete map of the sector. The techUK survey was voluntary and anonymous and focused mainly on commercial wholesale and colocation facilities, excluding much of the wider on-premise and enterprise population. The WRc estimate uses matched business-water connections and extrapolation. Water UK's figures begin with a different sample and then model current and future demand.
MOSL and WRc's national estimate sounds large: 1.879 billion litres. Spread over a year, it is about 5.15 million litres a day. But the final report also shows how concentrated the observed use was: 67% of the analysed connections used less than 1,000 cubic metres a year, while the six largest accounted for 65% of total use. Two of those six sites came online in 2024 and five since 2020.
That concentration is more decision-useful than the national percentage alone. A national average does not tell a water company what happens at 4pm on a hot day in one stressed supply zone.
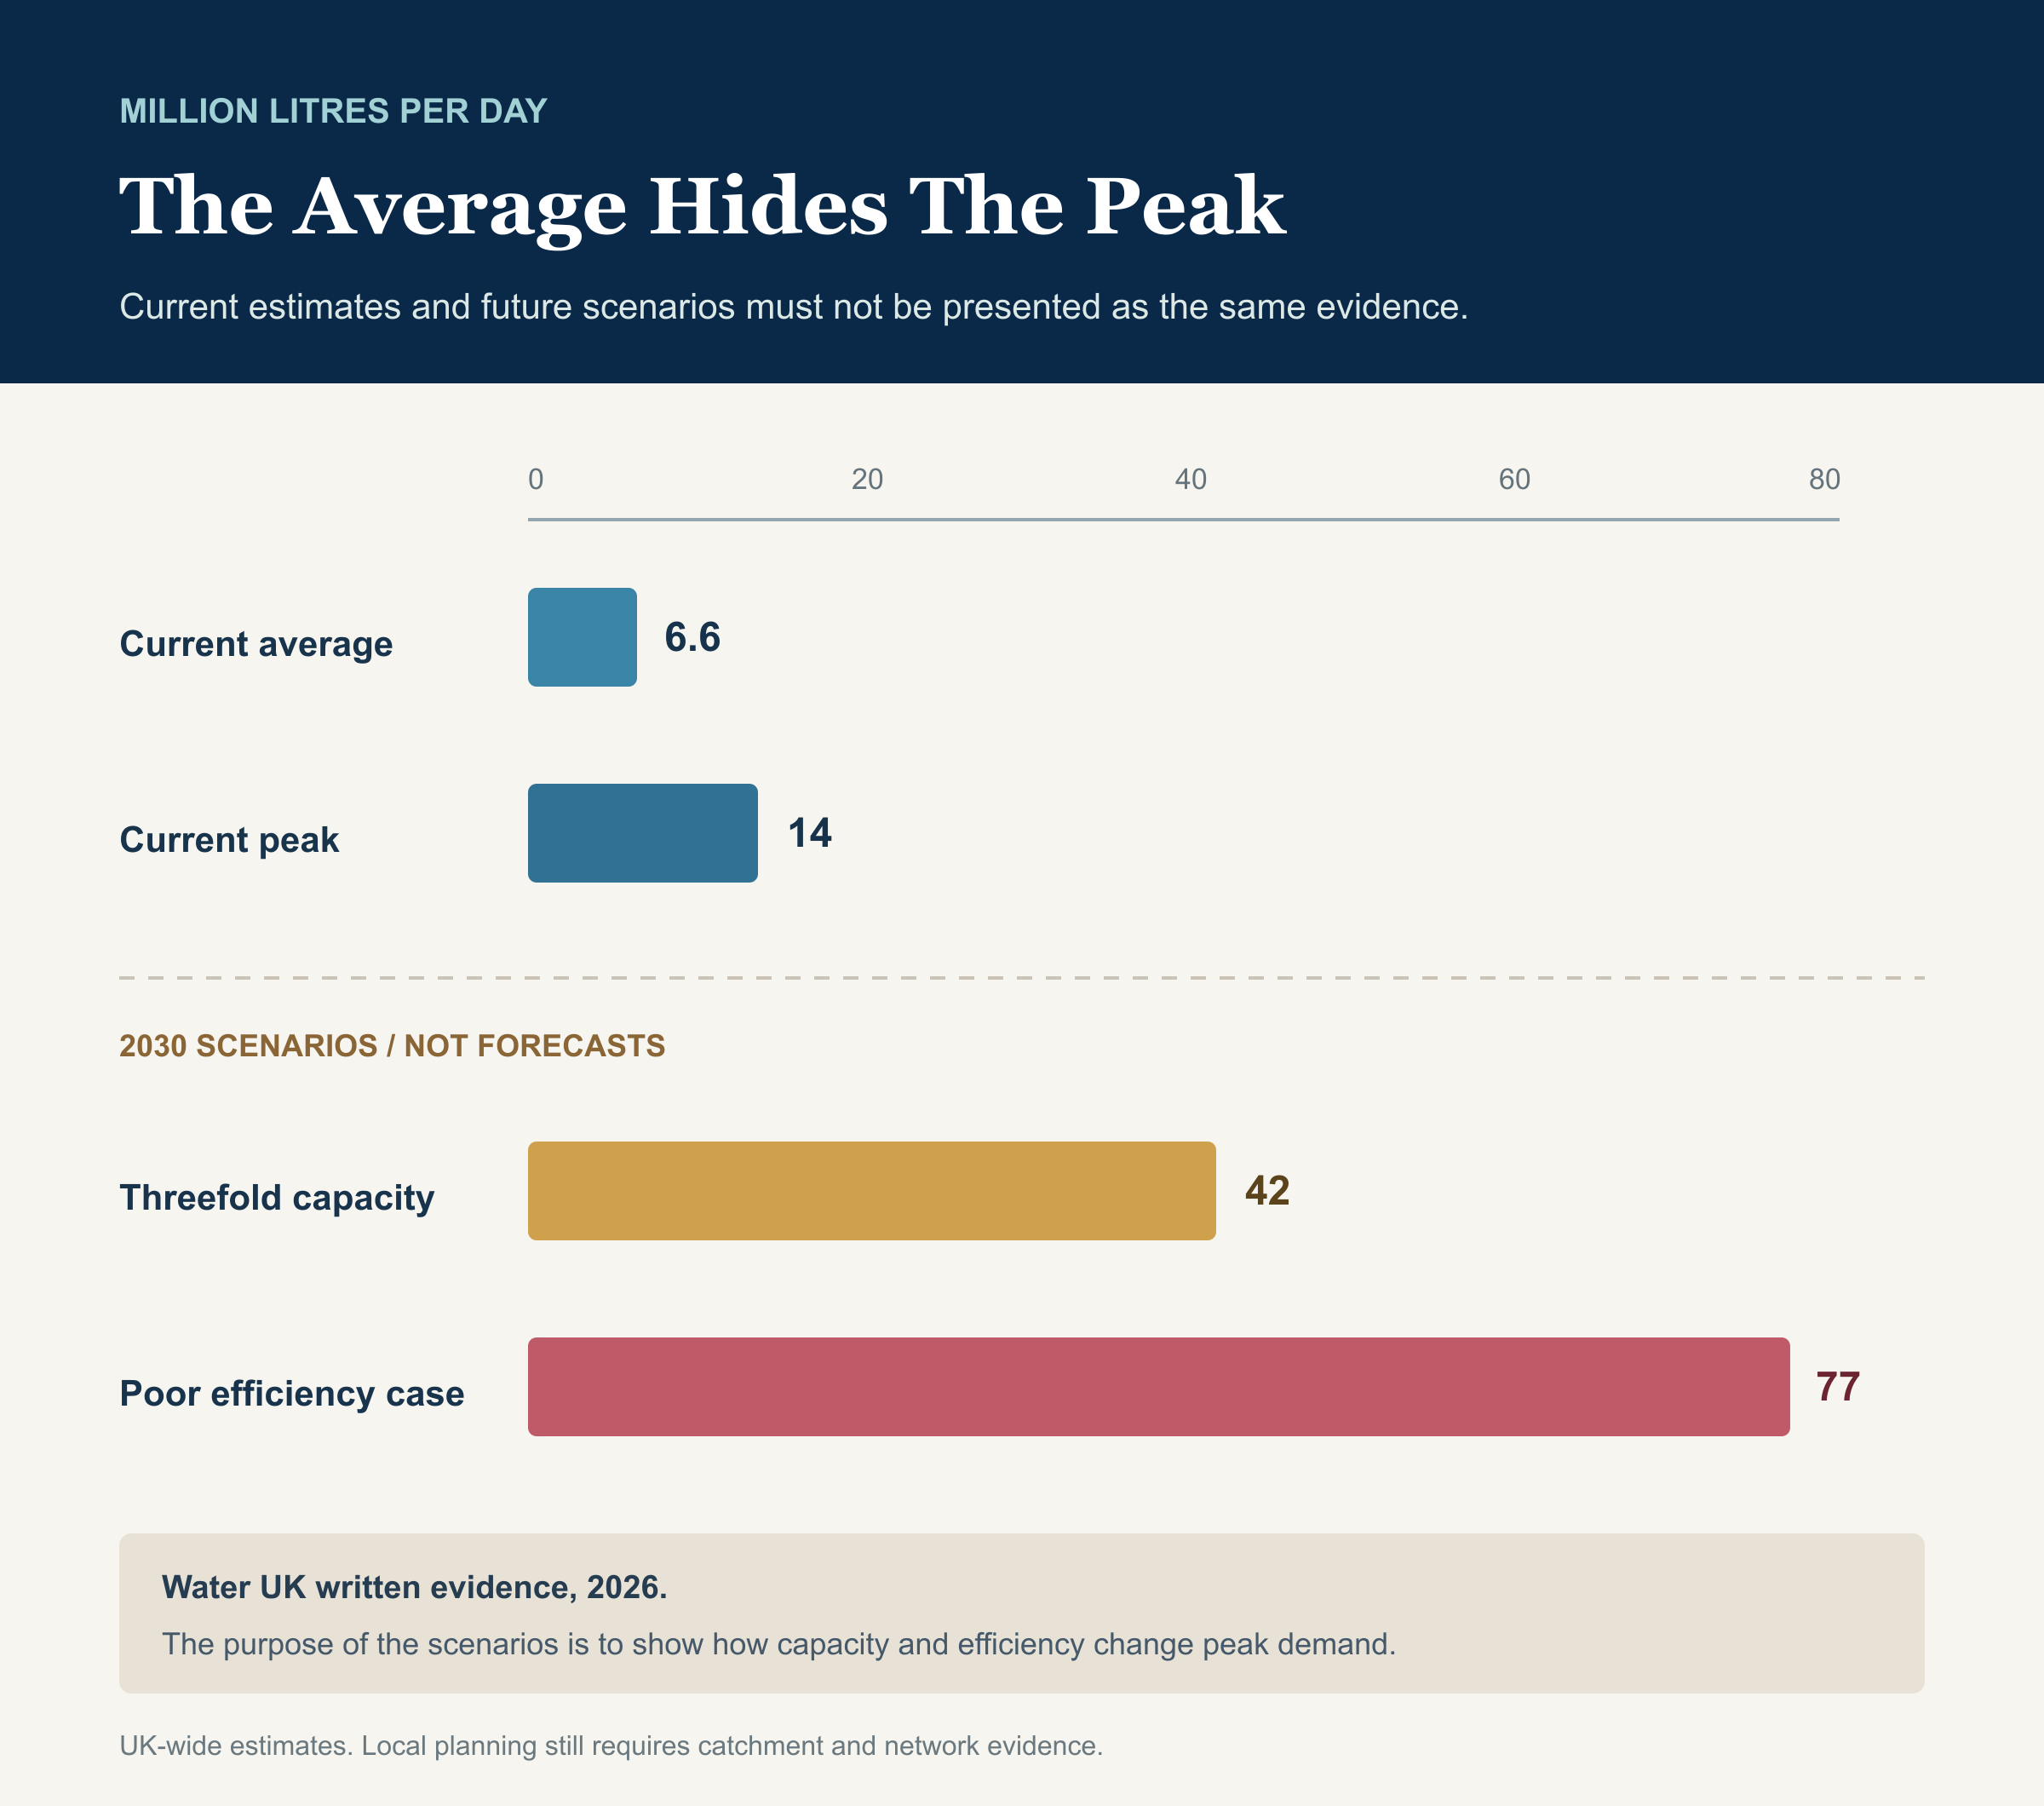
That is why Water UK's evidence matters. It says current UK data-centre demand averages about 6.6 million litres a day but can peak at about 14 million. It models a 2030 peak of 42 million litres a day if capacity trebles with similar efficiency. Its deliberately poor-efficiency scenario reaches 77 million litres a day.
Those 2030 figures are scenarios, not forecasts. They show the range that design choices can create.
What does that look like beside familiar buildings?
I wanted to compare data centres with things we already recognise. That is useful, but it has to be done carefully.
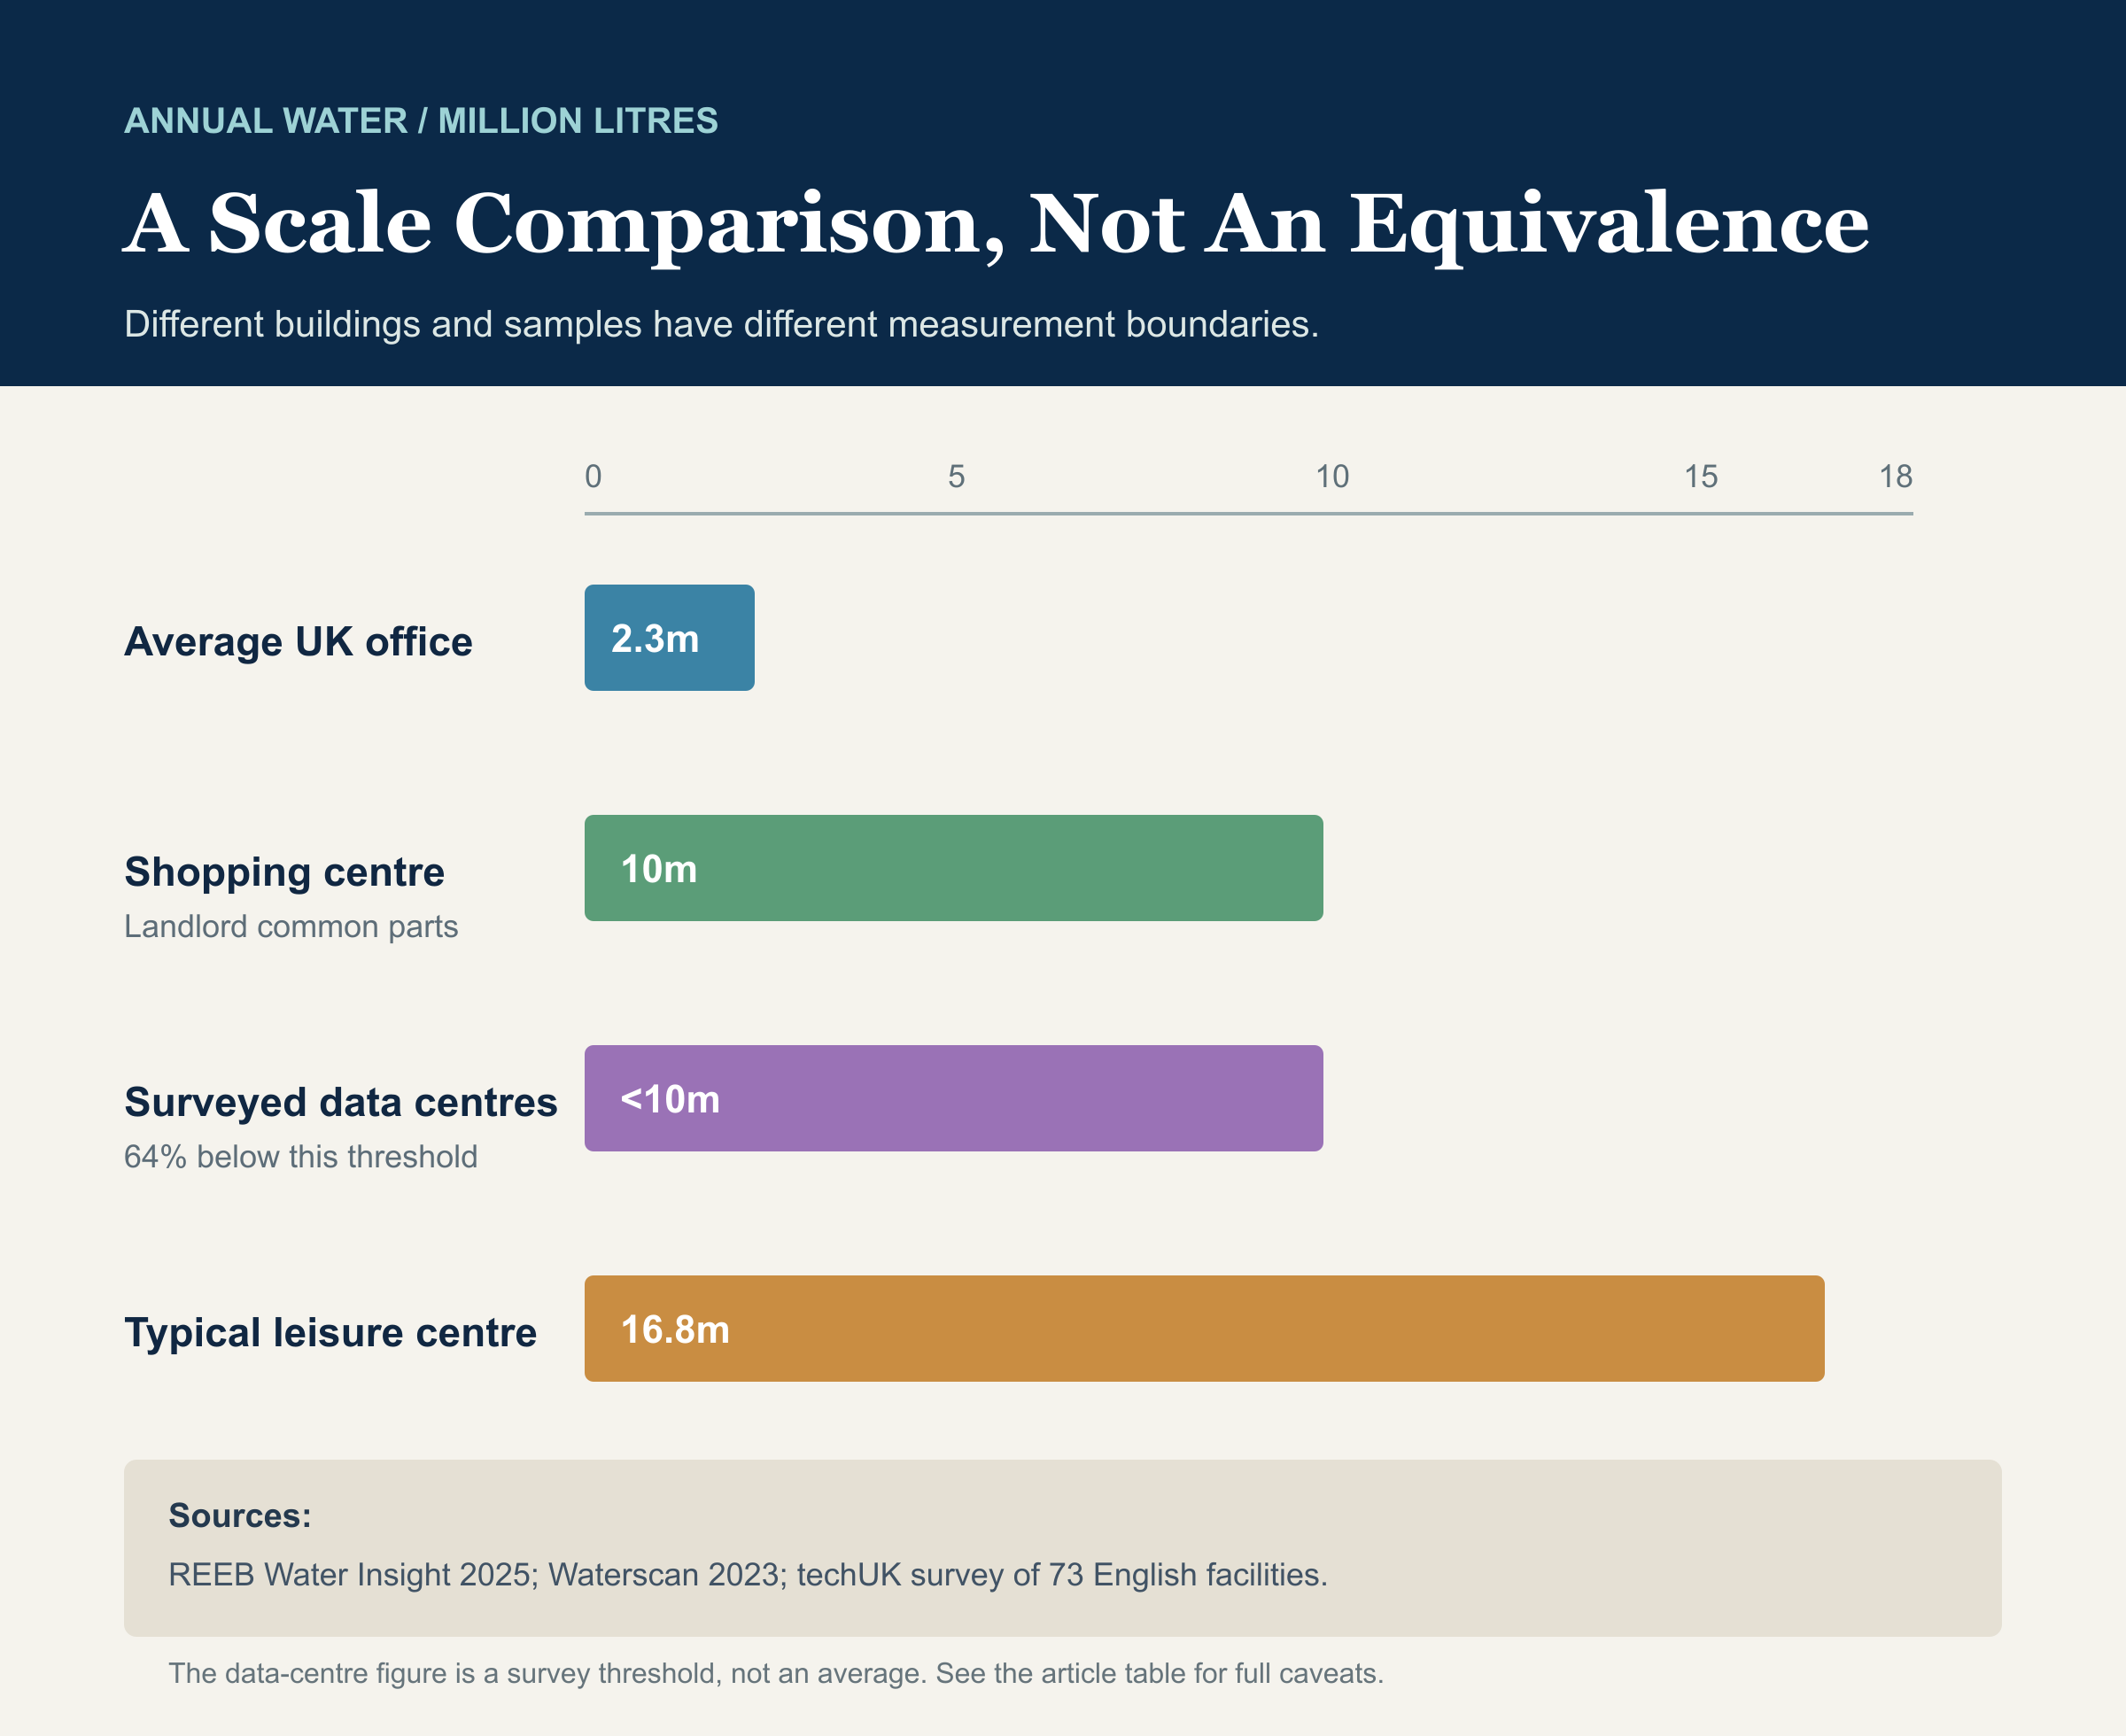
A Better Buildings Partnership sample puts an average UK office at about 2.3 million litres a year. Its average enclosed shopping centre used about 10 million litres a year for landlord-controlled common parts. A Waterscan report described a typical UK leisure centre at about 16.8 million litres a year.
In techUK's English data-centre survey, 64% of facilities were below 10 million litres a year.
These are observations about the present samples, not a prediction of future AI campuses. The larger and denser the proposed site, the less sensible it is to infer its demand from the median existing facility.
| Facility or threshold | Annual water | Scope and caveat |
|---|---|---|
| Average UK office | 2.3 million litres | REEB 2025 sample average; office whole-building benchmark. |
| Enclosed shopping centre | 10 million litres | REEB 2025 sample average; landlord-controlled common parts, not every tenant. |
| Surveyed English data centres | 64% below 10 million litres | techUK survey threshold, not a sector average. |
| Typical UK leisure centre | 16.8 million litres | Waterscan 2023 sector example; pools and showers make the service fundamentally different. |
This does not prove that data-centre water use is trivial. It shows that many facilities sit within a familiar commercial-building scale.
It also shows why a generic building comparison can fail. Water UK told Parliament that individual developers have requested connections of up to 21 million litres per day. One unusually large proposed campus can therefore matter more locally than hundreds of smaller, waterless or low-water facilities.
I looked for a sound measured Amazon warehouse figure because it would have made another familiar comparison. I could not find one with a sufficiently clear UK scope and measurement basis, so I have left it out. A memorable comparison is not worth much if the evidence underneath it is weak.
One almond, 38,000 ChatGPT queries?
Sam Altman recently said that producing one California almond uses as much water as roughly 38,000 ChatGPT queries. The quote is real, although Altman said during the interview that he was working from memory and might be wrong.
The arithmetic behind the comparison is surprisingly close. In June 2025, Altman published an average of 0.000085 US gallons of water for one ChatGPT query. Multiply that by 38,000 and the result is about 3.23 US gallons, or 12.2 litres. A peer-reviewed California study estimated a total water footprint of 12 litres per almond kernel.
| Input | Published figure | Boundary and caveat |
|---|---|---|
| Average ChatGPT query | 0.000085 US gallons, about 0.32 millilitres | Altman's published average. The public post does not provide enough method detail to reproduce it independently. |
| 38,000 queries | 3.23 US gallons, about 12.2 litres | Arithmetic using Altman's average, not a separate measurement. |
| California almond, broad water footprint | 12 litres per kernel | Fulton and colleagues' 2004-2015 average includes blue water, green rainwater and grey water, an accounting estimate of pollution impact. |
| California almond, applied freshwater | About 5.5-6.2 litres per 1.2 gram kernel | A later life-cycle study estimated 4,555-5,140 litres per kilogram. Its narrower boundary produces roughly half the broad footprint figure. |
My verdict is: the 38,000-query comparison is mathematically consistent with Altman's published query average and the broad 12-litre almond estimate, but it is not a universal conversion rate.
The 12-litre almond figure is not simply 12 litres pumped onto one tree. It combines irrigation, effective rainfall and a theoretical grey-water allowance for pollution. The query figure also varies with the model, response length, hardware, cooling system, location and electricity supply. We do not yet have enough public methodology to know that both sides of the comparison use exactly the same full-system boundary.
It is a useful sense-of-scale check. It is not proof that every 38,000 prompts literally consume one almond's water, and it says nothing about whether a particular data centre is placing too much demand on a particular catchment at a particular time.
What about other water-intensive foods?
The almond is not unusual in producing a surprisingly large number when we use a full food water footprint. I checked several familiar foods against global averages from the Water Footprint Network. To keep the arithmetic visible, every row states the serving assumption and uses Altman's published average of about 0.32 millilitres per ChatGPT query.
| Food and assumed serving | Broad water footprint | Equivalent average ChatGPT queries | Research basis |
|---|---|---|---|
| Beef, 150 grams | About 2,312 litres | About 7.2 million | Global bovine-meat average: 15,415 litres per kilogram |
| Chocolate, 100 grams | About 1,720 litres | About 5.3 million | Global chocolate average: 17,196 litres per kilogram |
| Chicken, 150 grams | About 649 litres | About 2.0 million | Global chicken-meat average: 4,325 litres per kilogram |
| Avocado, 150 grams | About 297 litres | About 924,000 | Global avocado average: 1,981 litres per kilogram |
| Egg, 60 grams | About 196 litres | About 609,000 | Global egg average: 3,265 litres per kilogram |
| Coffee made with 7 grams of roasted coffee | About 130 litres | About 404,000 | The crop study's explicit per-cup assumption |
Those totals combine green water, mainly rainfall stored in soil; blue water, from surface water and groundwater; and grey water, a modelled volume needed to dilute pollution to an agreed standard. They are not estimates of tap water poured directly into a product. The crop study found that 78% of the global crop footprint was green water, while the animal study put the global animal-production share at 87.2% green water and said 98% of its total footprint came from animal feed.
The figures also move substantially by country, climate and production system. The authors explicitly warn that a comparison based on global averages can reverse in a specific region. So this table is useful for understanding scale, but it is not a moral league table and it does not tell us whether a particular food or data centre is stressing a particular UK catchment.
The average hides the peak
| Case | Million litres a day | Status |
|---|---|---|
| Current average demand | 6.6 | 2026 Water UK UK-wide estimate |
| Current peak demand | 14 | 2026 Water UK UK-wide estimate |
| 2030 peak with threefold capacity | 42 | Scenario, not a forecast |
| 2030 poor-efficiency peak | 77 | Worst-case scenario, not a forecast |
The timing is important. The Environment Agency's latest report available for this article, covering 17 to 23 July 2026, classified no English area as being in drought, but nine areas were in prolonged dry weather. By 21 July, England had received only 3% of its long-term average July rainfall. Reservoir storage was 75.3%, and water demand had risen by up to 30% on the hottest days.
Evidence update: that statement accurately described the 17 to 23 July snapshot. Water Magazine reported on 29 July that seven Environment Agency areas had since moved into drought following the 28 July National Drought Group briefing. The change within days reinforces the point: drought status is dated operational evidence, not a permanent national label.
Conditions can change quickly. It is also why saying Scotland or Wales simply have “loads of water” is not an engineering answer. The relevant question is the specific catchment, its abstraction limits, its seasonal stress and the capacity of the local network.
Power changes the water choice
Data-centre electricity is not a side issue. It changes which cooling choices are practical and whether moving water use off-site merely hides it inside the electricity supply chain.
DESNZ's meter-matched estimate puts Great Britain's data-centre electricity use at 4.5 TWh in 2024, around 2% of grid consumption. It is labelled Official Statistics in Development and excludes enterprise data centres. Other methods produced materially different 2023 estimates, from 2.6 TWh for England and Wales to 7.6 TWh for Great Britain, so 4.5 TWh should be treated as the current official estimate rather than a perfect census. Within that estimate, London and the South East accounted for 77%. Slough alone used about 1.3 TWh for data centres, 29% of the estimated national data-centre total and roughly 65% of local grid consumption.
The 2025 UK Compute Roadmap, updated in April 2026, anticipates at least 6 GW of AI-capable data-centre capacity by 2030, around three times current capacity. AI racks are also becoming denser. More computing can be delivered in less floor space, but heat must still be moved away from the chips.
Air cooling can avoid direct on-site water but may use more fan and chiller energy. Evaporative cooling can reduce electricity use in some conditions but consume more water. Closed-loop and direct-to-chip liquid cooling can handle dense racks efficiently, but the heat still needs to be rejected somewhere.
There is no magic cooling system. There is a design choice that must fit the workload, climate, power source, water source and place.
What better design looks like
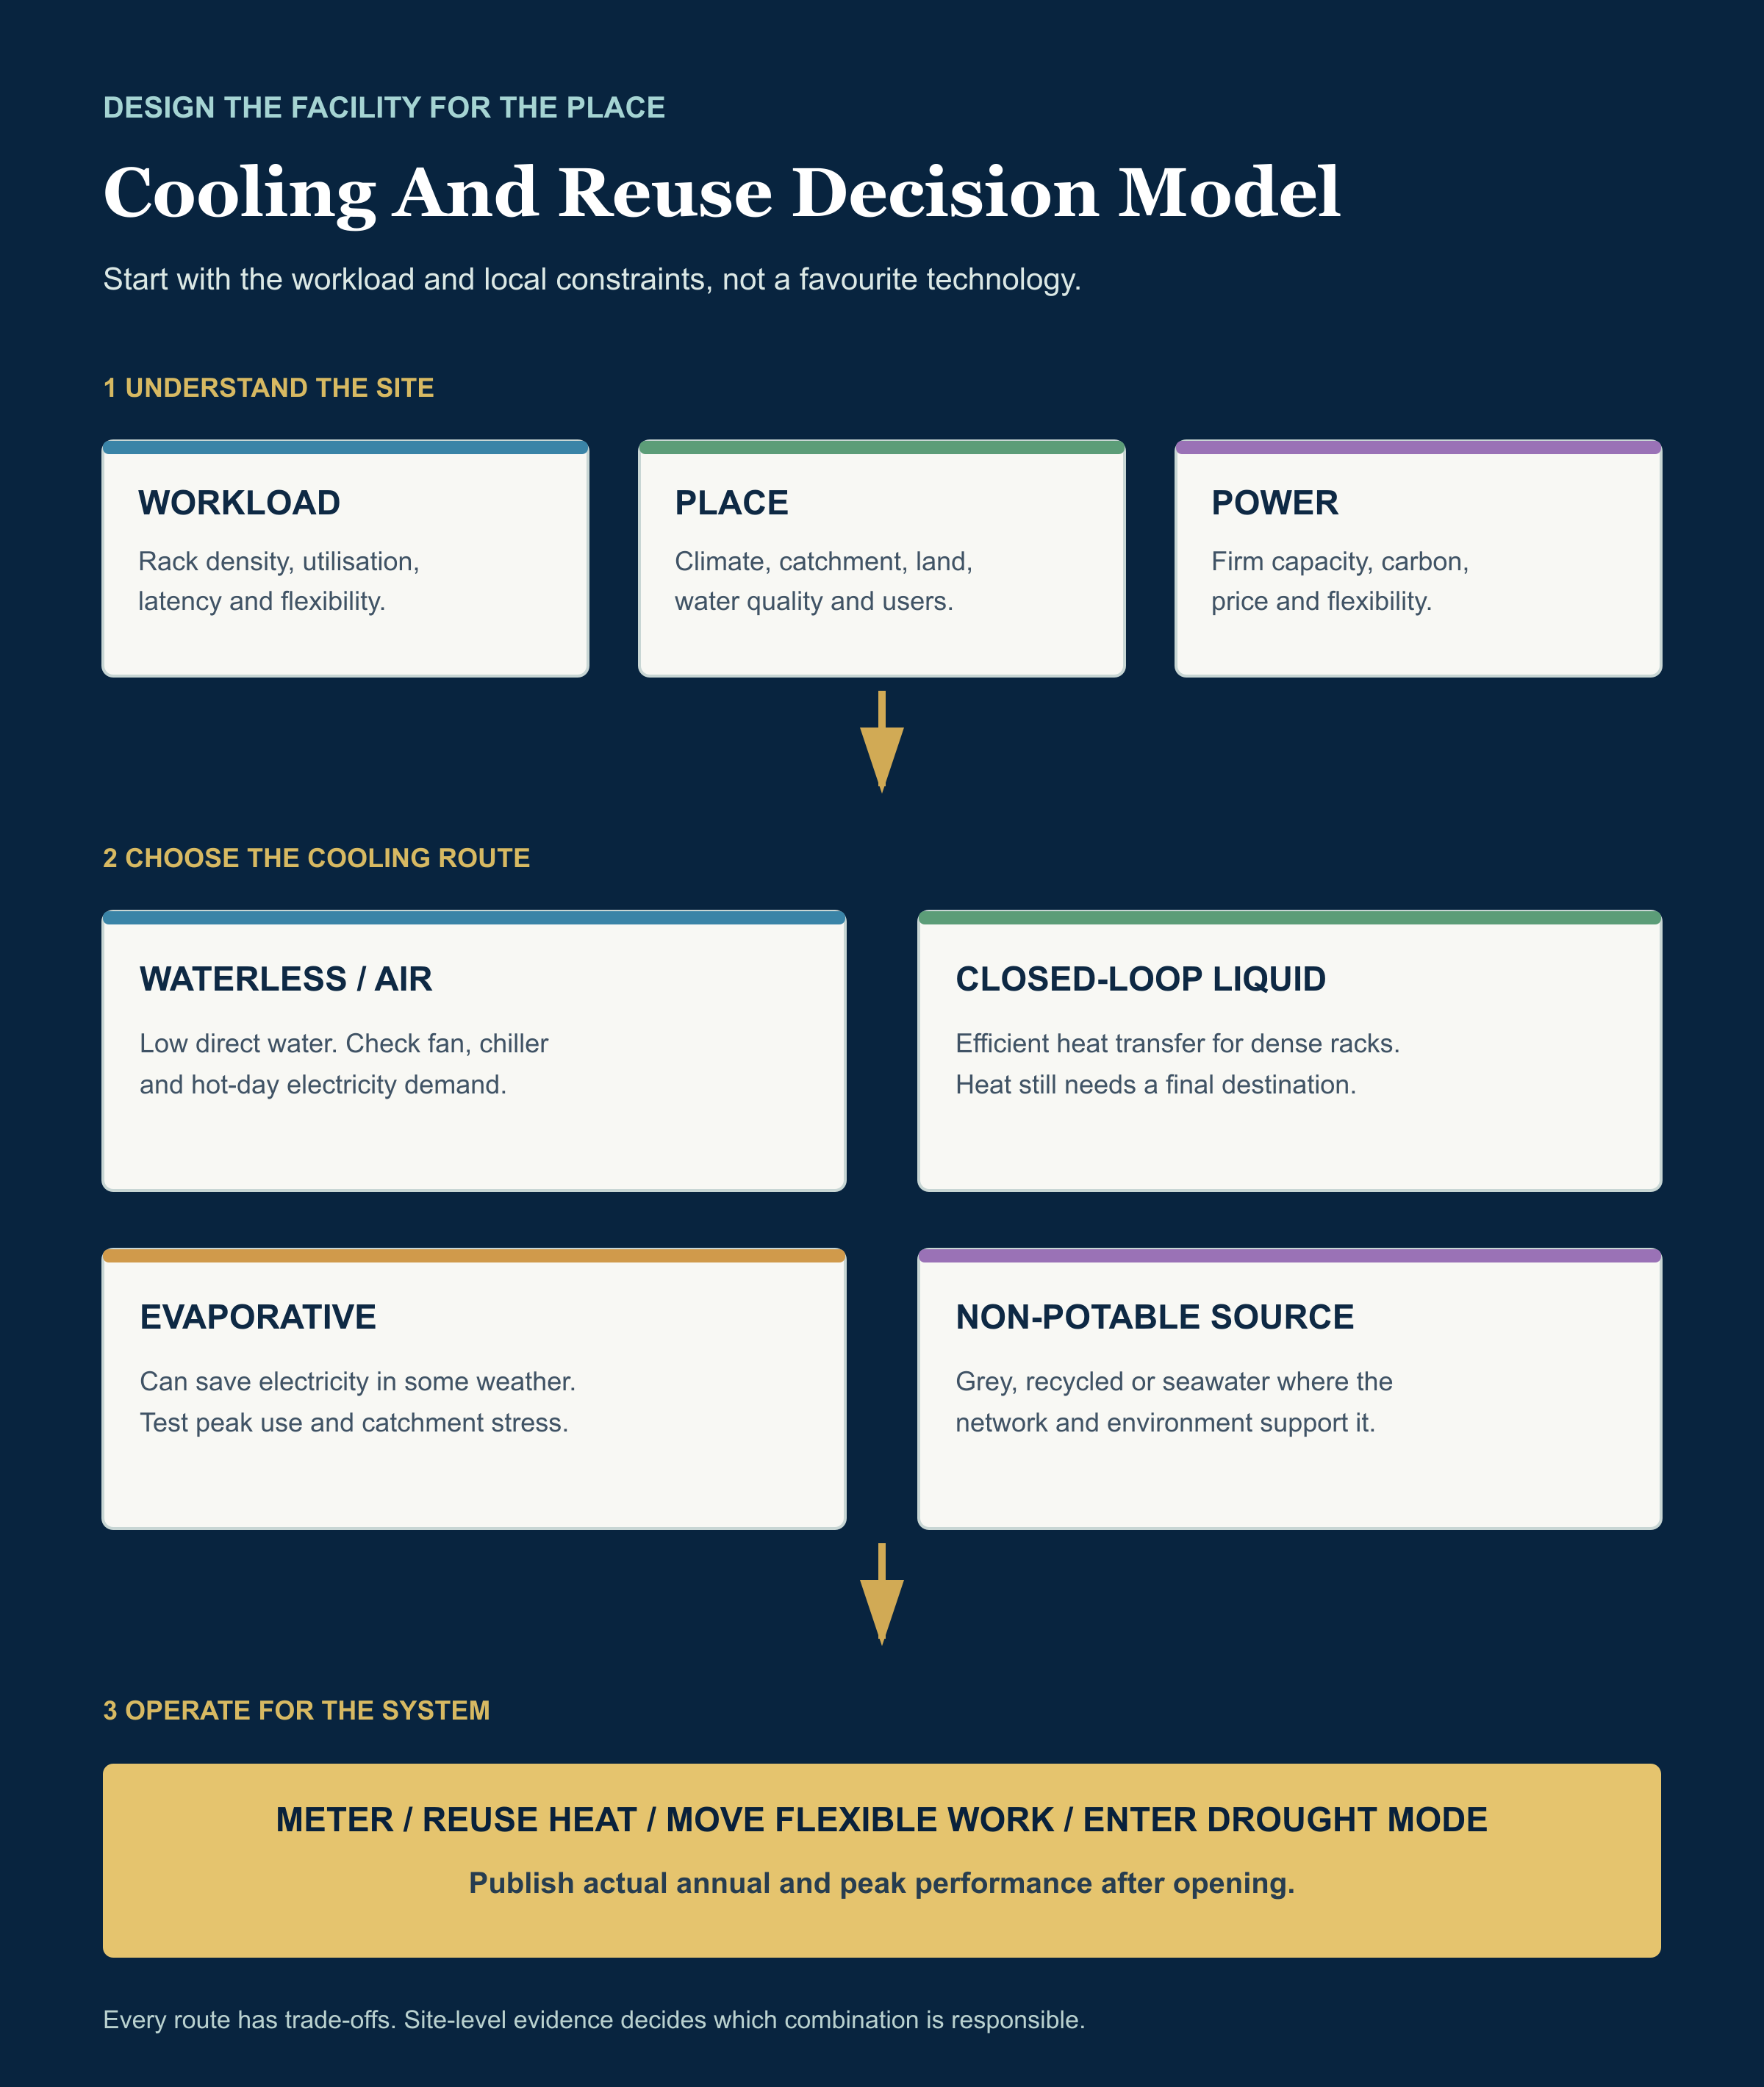
The practical options are already visible:
- Waterless or near-waterless normal operation. Some operators use outside air, closed loops or mechanical cooling for most or all of the year.
- Direct-to-chip liquid cooling. Dense AI hardware can transfer heat into a closed circuit close to the processor.
- Non-potable water. Google's Belgian facility reports using grey water from a nearby industrial canal rather than drinking water.
- Seawater cooling. Google's Hamina site in Finland uses seawater, demonstrating an option for the right coastal industrial location.
- Heat reuse. Google's Hamina project says recovered heat can provide about 80% of local district-heating demand. Meta's current Odense fact sheet reports 165,000 MWh of heat delivered to the district system, enough for up to about 9,000 homes. These are vendor-reported examples, but the engineering opportunity is real.
- Drought operating modes. A facility can deliberately accept higher electricity use or move flexible workloads to protect water during hot, dry periods.
- Workload flexibility. A 2026 National Grid trial showed a 96-GPU Blackwell Ultra cluster cutting demand by more than a third in under a minute without disrupting critical workloads. It was an industry trial, not proof that every workload is flexible, but it demonstrates a useful capability.
These choices can create new trade-offs. Recycled water requires pipes and treatment. Heat reuse needs a customer close enough to use it. Seawater systems need marine safeguards. Workload movement needs networks, software and contracts designed for it.
But those are engineering questions. They are better than arguing from one frightening national number.
What every planning proposal should disclose
I think communities and planners should receive a simple, comparable infrastructure statement for every substantial data-centre proposal.
- Annual water withdrawal and consumption, with the year and operating assumptions.
- Peak daily and hourly demand, including hot-day and full-campus scenarios.
- Water source: potable, non-potable, recycled, grey, seawater or another supply.
- WUE and its boundary, alongside the wider direct and indirect water explanation.
- Catchment and network stress, not merely the national water position.
- Cooling design, rack-density assumptions and fallback mode.
- Grid demand, connection status, firm-power need and flexibility.
- Reuse and heat recovery, including whether there is a credible nearby customer.
- Drought resilience: what changes when water is constrained?
- Expansion envelope: the initial building and the possible completed campus.
- Infrastructure cost allocation: which grid, water and network upgrades are required, and who pays for them?
- Noise and air quality: including cooling equipment, construction traffic and backup-generator testing.
- Land, flood and biodiversity effects: including landscape or green-belt impact where relevant.
The disclosure should say what is measured, what is estimated and what is a worst-case scenario. It should be updated once the facility is operating.
That gives the public something better than a promise and regulators something better than an annual average.
The conclusion is local
The most decision-useful finding is concentration. In WRc's analysed connections, the six largest sites accounted for 65% of use. Water UK says individual connection requests can reach 21 million litres a day. Those are the numbers a local planner or water company must test.
The national estimate remains useful context: extrapolated potable public-supply use was about 0.2% of the English non-household market, and many observed facilities used little or no cooling water. But it came from 208 matched connections and should not be presented as a complete national footprint.
That does not make local water questions disappear.
Large campuses, peak hot-day demand, clustered development and stressed catchments can create serious problems. Poor design can turn capacity growth into avoidable demand. Good design can use closed loops, non-potable supplies, heat reuse and workload flexibility to reduce it.
So I am not persuaded by “data centres use too much water” as a universal objection.
I am equally unconvinced by “the national percentage is small, therefore every site is fine”.
Britain needs computing infrastructure. It also needs to put the right facility, with the right cooling and power design, in the right place.
That is the subject of part two: Why The UK Needs More Data Centres.
Sources and notes
The official Environment Agency report for 17 to 23 July 2026 recorded no English areas in drought. A 29 July Water Magazine report then recorded seven areas in drought after the 28 July National Drought Group briefing. The position should be rechecked whenever this article is republished or used in a live planning discussion.
- UK Compute Roadmap
- DESNZ Energy Trends, June 2026
- WRc: Water Efficient Data Centres final report
- techUK: Data Centre Water Use in England
- Water UK written evidence to Parliament
- Environment Agency dry weather and drought report, 17 to 23 July 2026
- Water Magazine: seven Environment Agency areas moved into drought, 29 July 2026
- GDSA and Defra: Water use in data centre and AI
- University of East Anglia evidence on data centres and local water stress
- Better Buildings Partnership REEB Water Insight 2025
- Waterscan UK Leisure Sector Report 2023
- Sources with Alex Heath: Sam Altman on OpenAI's next model and the AI backlash
- Tom's Hardware report and transcript excerpt of Altman's almond comparison
- Sam Altman: The Gentle Singularity
- Fulton, Norton and Shilling: Water-indexed benefits and impacts of California almonds
- Marvinney and colleagues: A scalable life-cycle assessment of California almonds
- Water Footprint Network: The green, blue and grey water footprint of crops and derived crop products
- Mekonnen and Hoekstra: peer-reviewed crop water-footprint study
- Water Footprint Network: The green, blue and grey water footprint of farm animals and animal products
- npj Clean Water: Data centre water consumption
- National Grid data-centre flexibility trial
- Google Belgium grey-water case study
- Google Hamina seawater and heat-recovery case study
- Meta Odense data-centre fact sheet