
How corrupt is Britain? And compared with whom?
Those are slightly different questions. If we only look at our own headlines, it is easy to conclude that everything is falling apart. If we only compare ourselves with countries doing much worse, it is equally easy to decide that everything is fine.
I wanted to look at the data. The useful answer is this: the UK still scores relatively well internationally, but its direction of travel is worrying. Both things can be true. Neither gives us permission to stop asking questions.
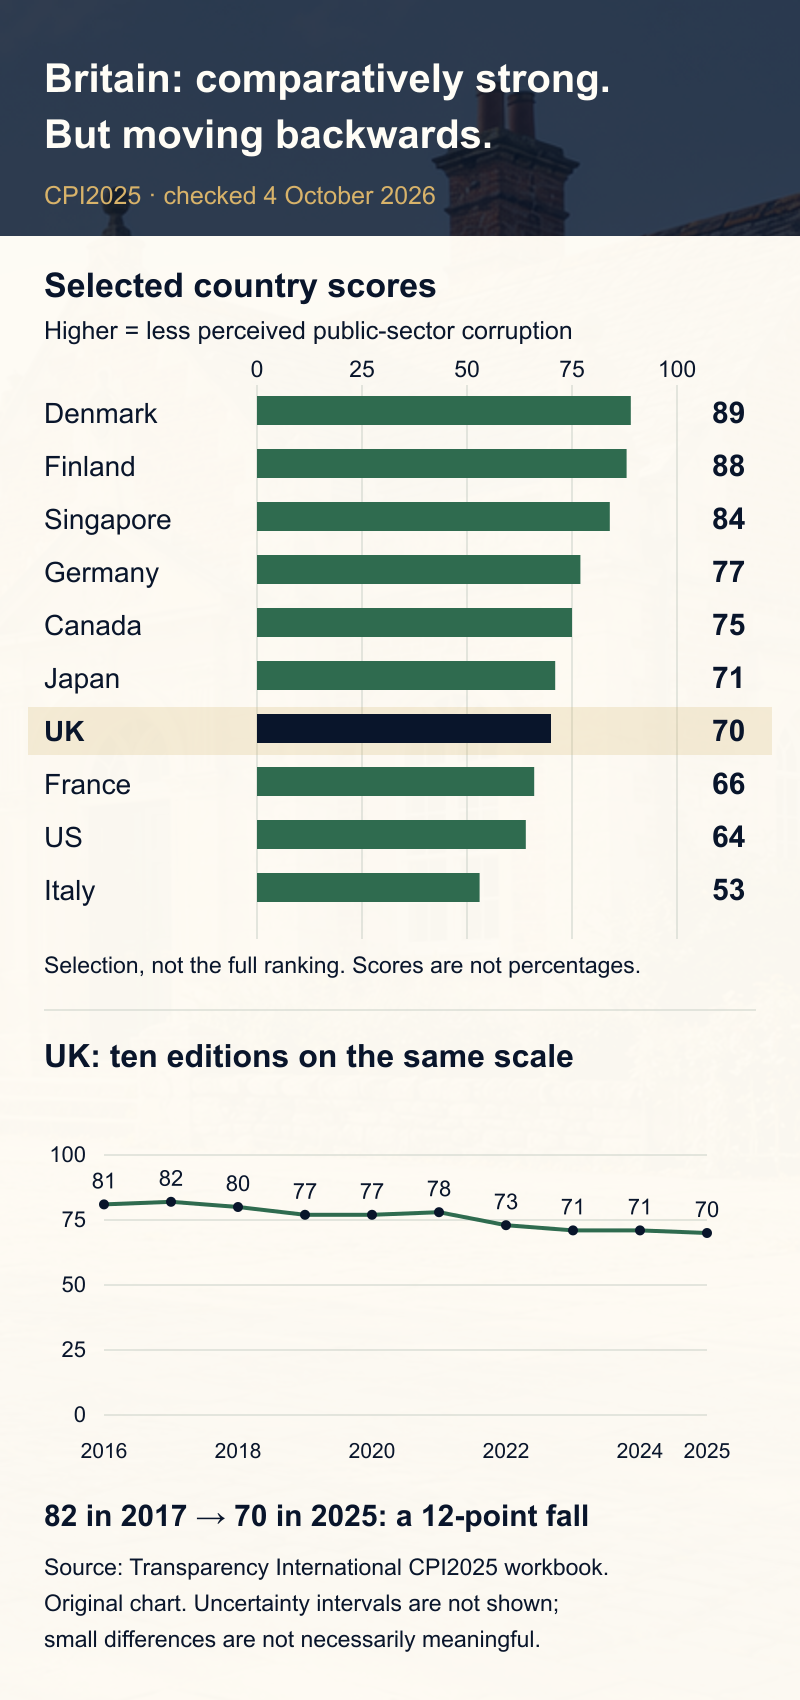
The latest Corruption Perceptions Index available at this check is CPI2025, published on 10 February 2026. Britain scores 70 out of 100, ranking 20th among 182 countries and territories. In 2017, it scored 82 and ranked eighth. This article checks the underlying workbook rather than relying only on the headline. Transparency International's index, original results and historical data.
Evidence checked: 4 October 2026. These are the 2025 index results, not a newly invented “2026 corruption index”.
The short version
| Question | Answer | Important qualification |
|---|---|---|
| How does Britain score? | 70/100; 20th of 182 | Higher scores mean less perceived public-sector corruption. |
| Is that high internationally? | Above the reported global average of 42 | A world average is not a standard Britain should be satisfied merely to beat. |
| How does it compare with the G7? | Fourth of seven by published score | Behind Germany, Canada and Japan; ahead of France, the US and Italy. |
| Has it improved? | No: 82 in 2017 to 70 in 2025 | A 12-point decline, flagged as significant in TI's workbook; not “12% more crimes”. |
| Is 70 a percentage? | No | It does not mean 70% honest, 30% corrupt, or a 30% probability of a bribe. |
Sources: CPI2025 workbook and official global findings. The G7 comparison is my calculation using the seven published country scores, not a separate TI index.
What are we actually measuring?
Corruption is broader than somebody slipping an envelope across a desk. It can involve public money being diverted, appointments being made through connections, public office being used for private advantage, or decisions being captured by narrow interests.
The CPI measures perceptions of public-sector corruption, drawing on expert and business assessments. A country's score combines at least three sources from a pool of 13. It is not a survey asking every citizen whether they paid a bribe, and it is not a count of convictions. How the CPI is calculated.
That makes it useful, but not complete. Hidden behaviour is difficult to measure directly. A conviction count also has a problem: more prosecutions could mean more corruption, more effective enforcement, or both. Very few prosecutions might mean very little wrongdoing. Or it might mean nobody is looking properly.
So I would not dismiss an index because it uses perceptions. Nor would I treat a perception score as if it were a laboratory measurement of every corrupt act.
There is another distinction worth keeping: the score concerns institutions and public-sector behaviour, not the moral character of a country's people. It is not a judgment about ethnicity, religion, or whether individuals from a country can be trusted.
How does the UK compare with other countries?
Here is a broad selection: high-scoring countries, European neighbours, major economies and countries facing much more serious institutional difficulties. It is not a list of the “largest economies”, and it is not a complete list of all 182 places.
| Country | Score /100 | Global rank | Points above/below UK |
|---|---|---|---|
| Denmark | 89 | 1 | +19 |
| Finland | 88 | 2 | +18 |
| Singapore | 84 | 3 | +14 |
| New Zealand | 81 | 4 | +11 |
| Norway | 81 | 4 | +11 |
| Sweden | 80 | 6 | +10 |
| Switzerland | 80 | 6 | +10 |
| Netherlands | 78 | 8 | +8 |
| Germany | 77 | 10 | +7 |
| Australia | 76 | 12 | +6 |
| Ireland | 76 | 12 | +6 |
| Canada | 75 | 16 | +5 |
| Japan | 71 | 18 | +1 |
| United Kingdom | 70 | 20 | 0 |
| United Arab Emirates | 69 | 21 | -1 |
| France | 66 | 27 | -4 |
| United States | 64 | 29 | -6 |
| South Korea | 63 | 31 | -7 |
| Rwanda | 58 | 41 | -12 |
| Saudi Arabia | 57 | 45 | -13 |
| Spain | 55 | 49 | -15 |
| Italy | 53 | 52 | -17 |
| Poland | 53 | 52 | -17 |
| China | 43 | 76 | -27 |
| South Africa | 41 | 81 | -29 |
| Vietnam | 41 | 81 | -29 |
| India | 39 | 91 | -31 |
| Brazil | 35 | 107 | -35 |
| Indonesia | 34 | 109 | -36 |
| Türkiye | 31 | 124 | -39 |
| Mexico | 27 | 141 | -43 |
| Nigeria | 26 | 142 | -44 |
| Russia | 22 | 157 | -48 |
| Venezuela | 10 | 180 | -60 |
| Somalia | 9 | 181 | -61 |
| South Sudan | 9 | 181 | -61 |
Source: TI's original CPI2025 workbook. Differences from Britain are simple score subtraction, not estimates of extra corrupt transactions. Equal scores share a rank; skipped rank numbers reflect ties.
Britain is not near the bottom of this table. But nor is it sitting with Denmark and Finland at the top. That is a much more useful starting point than either “we are uniquely terrible” or “there is nothing to worry about”.
Singapore also reminds us not to turn this into a simplistic geography story. And Rwanda's score is higher than those of several much larger economies. Economic size is not the same thing as institutional integrity. These comparisons do not, by themselves, establish why any country scores as it does.
Europe and the G7 are more demanding comparisons
Britain is below a number of northern and western European peers, including Ireland, the Netherlands, Germany and the Nordic countries. It is above France, Spain, Italy and Poland on this measure. Europe is not one uniform system.
TI's published average for its Western Europe and European Union region is 64. That is a particular 31-country grouping, including Britain and non-EU countries. It is not an EU27 average. Geography and membership need to be labelled properly before we start drawing conclusions. Workbook regional averages.
| Country | Score /100 | Global rank |
|---|---|---|
| Germany | 77 | 10 |
| Canada | 75 | 16 |
| Japan | 71 | 18 |
| United Kingdom | 70 | 20 |
| France | 66 | 27 |
| United States | 64 | 29 |
| Italy | 53 | 52 |
Source: CPI2025 country scores. The unweighted G7 arithmetic mean is 68.0. Each country counts once; this is not population-weighted or GDP-weighted. Britain is slightly above that mean, while ranking fourth within the group.
I would not make much of Japan's one-point lead over Britain. The workbook gives Britain's 90% confidence interval at roughly 67.4–72.6 and Japan's 90% confidence interval at 66.9–75.1. Those ranges overlap substantially. The point estimates determine the league table, but they do not prove that every small difference is meaningful. CPI2025 technical methodology.
The UK trend is the more uncomfortable part
| Index year | Score /100 | Global rank | Score change from previous year |
|---|---|---|---|
| 2016 | 81 | 10 | 0 |
| 2017 | 82 | 8 | +1 |
| 2018 | 80 | 11 | -2 |
| 2019 | 77 | 12 | -3 |
| 2020 | 77 | 11 | 0 |
| 2021 | 78 | 11 | +1 |
| 2022 | 73 | 18 | -5 |
| 2023 | 71 | 20 | -2 |
| 2024 | 71 | 20 | 0 |
| 2025 | 70 | 20 | -1 |
Source: TI historical and significant-change worksheets. The first annual change uses the 2015 score of 81. CPI scores are comparable from the 2012 methodological change onwards; older editions should not be stitched onto this series as though nothing changed.
The UK moved from 82 to 70 between 2017 and 2025. The workbook classifies that as a significant decline. This is not just Britain moving down because another country moved up.
But it is still a decline in a perception-based index. It does not tell us how many additional bribes occurred, how much money was diverted, or what percentage of the decline belongs to a particular government.
TI UK links the deterioration to concerns around political integrity and the use of public office. That is its analysis, not a causal experiment identifying the effect of each scandal or policy. I think the longer trend deserves attention without being forced into whichever party-political argument somebody already wanted to make. TI UK's assessment.
Who produces these numbers, and can we trust them?
Transparency International is an anti-corruption campaigning organisation. It is not a disinterested machine, and its policy recommendations should be read as recommendations. Its CPI scores, however, aggregate external assessments rather than simply recording what TI's staff think about each country.
There are other measures worth checking. They ask different questions, which is precisely why they are useful.
| Measure | What it asks | Evidence and limitation |
|---|---|---|
| TI Corruption Perceptions Index | How corrupt is the public sector perceived to be? | Expert/business assessments. Broad comparison, not recorded incidence. |
| World Bank WGI: Control of Corruption | How far is public power used for private gain, including capture? | Survey/expert sources and a statistical model. Uncertainty accompanies scores. |
| OECD Public Integrity Indicators | Are specified safeguards present and operating? | Administrative evidence against criteria. Not a count of corruption cases. |
Methodologies: TI, World Bank, OECD.
The current World Bank documentation describes 35 sources and a 1996–2025 series. Its revised method reports both model estimates and 0–100 scores with uncertainty intervals. Those are not CPI scores just because the scales look similar. We should not combine a country estimate from an older release with a revised series and pretend that they are directly interchangeable.
Nor are CPI and WGI completely independent confirmations: they share some underlying providers. Agreement is informative, but it is not the same as two unrelated experiments finding the same result. OECD's criteria-based evidence adds another kind of check.
My approach is to inspect the method, date, underlying evidence and limitations. Government publication does not automatically make a claim neutral. An NGO publication does not automatically make it wrong.
Britain's rules look better than some of its practice
The OECD's 2026 UK note separates formal arrangements from implementation. The following numbers are percentages of specified criteria fulfilled. They are not “percentages of corruption prevented”.
| Area | UK rules/framework | UK practice | OECD rules/framework | OECD practice |
|---|---|---|---|---|
| Strategic framework | 60% | 30% | 38% | 32% |
| Lobbying | 80% | 67% | 43% | 38% |
| Conflict of interest | 56% | 22% | 80% | 45% |
| Political finance | 80% | 86% | 76% | 58% |
| Access to public information | 56% | 69% | 72% | 62% |
Source: OECD UK country note. Rules and practice use different criteria: subtracting them does not measure how many laws are ignored. Higher practice than regulation is possible. Missing UK results for judicial integrity, prosecutorial integrity and civil-service disciplinary systems mean unavailable data, not zero integrity.
The picture is mixed: relatively strong lobbying and political-finance results, but a clear conflict-of-interest weakness. It would be misleading to omit either side.
This is where I become interested as an operator. A policy can be beautifully written, approved by the right committee and filed in the right place. What happens when somebody has to check it, challenge it or enforce it?
That is the distinction between owning a fire extinguisher and knowing that it works. The certificate matters. So does the inspection.
A good domestic score can still miss dirty money from elsewhere
The CPI does not cover money laundering, illicit financial flows or the professional services that enable corruption. A country can have relatively low perceived domestic public-sector corruption while still providing a place for wealth stolen elsewhere to be held or moved. TI makes this limitation explicit. What the CPI covers and excludes.
For Britain, a major international financial centre, that is an important qualification. A favourable domestic ranking is not a clean bill of health for every cross-border transaction.
The government's 2025 anti-corruption strategy addresses corrupt actors and funds, domestic vulnerabilities and international resilience. It contains 123 commitments. Those are promised actions, not 123 demonstrated successes.
I would want to know what changed: were risky decisions made more transparent, conflicts identified earlier, investigations completed appropriately and stolen assets recovered? A new strategy is the beginning of that conversation, not the end.
We should also keep fraud and corruption separate. They can overlap, but fraud does not always involve abuse of entrusted public power. A large fraud estimate cannot simply be relabelled as “Britain's corruption bill”.
Why this matters for making the country wealthier
In Making the Cake Bigger, I looked at how a country becomes more productive. Integrity belongs in that discussion.
Imagine two firms competing for a public contract. One offers the better service. The other offers the better connection. If the connection wins, we have not just behaved unfairly. We may have bought less capability with the same money.
That is an illustration, not a claim about a particular contract. But it explains why transparent decisions matter to businesses and taxpayers alike.
I do not think we should promise that adding ten points to an index will produce some fixed percentage of GDP growth. The CPI cannot establish that. My conclusion is simpler: a country trying to increase its productive capacity should care whether resources are allocated through fair competition and inspectable decisions.
Trust is useful, but blind trust is not a control. We need systems that make it possible to check.
What would improvement actually look like?
The following is my proposed practical test, not a government commitment or a new official index.
| Area | Useful evidence of progress | What would not be enough |
|---|---|---|
| Conflicts of interest | Timely declarations, recorded checks and documented resolutions | “Everyone has signed the form.” |
| Procurement | Traceable awards, ownership, reasons and challenge routes | A dashboard of spending with no explanation of decisions. |
| Political influence | Accessible, timely records of interests, donations and relevant meetings | Information scattered across incompatible registers. |
| Enforcement | Independent processes and published outcomes, with proper due process | A rising prosecution count presented without context. |
| Illicit wealth | Evidence of tracing and recovering assets, with lawful safeguards | A good domestic CPI score used as a defence of every transaction. |
| Strategy delivery | Named owners, dates, baselines and measurable outcomes | A long list of commitments treated as completed work. |
AI might help connect records or flag unusual patterns for investigation. But an unusual pattern is not proof of corruption. People need to check the evidence, respect privacy and due process, and be able to explain why a decision was made. Otherwise we risk replacing one opaque system with another.
So, how corrupt is Britain?
Compared with much of the world, Britain has a relatively favourable score. Compared with some of the countries we should be willing to learn from, it has room to improve. Compared with its own 2017 position, it has deteriorated.
I think that is the balanced conclusion. Not national self-congratulation. Not national despair. And certainly not a licence to accuse people on the strength of a league table.
The question is not only whether we have rules. It is whether the rules work when somebody important would rather they did not.
Sources and how to reuse the figures
Country scores, ranks, confidence intervals and the UK trend were checked against TI's original workbook. Its 2017–2025 UK decline classification is reproduced faithfully. The country selection and G7 arithmetic mean are this article's calculations; the full official dataset remains the source for countries not shown.
There is a small unresolved publication discrepancy: TI's report says 122 countries score below 50, while counting the published integer scores in the downloaded workbook gives 123. I have not silently changed either source or invented an explanation. “Roughly two thirds” is the appropriate summary here. The official reported global mean is 42; an average of the workbook's rounded scores is approximately 42.5.
Read the CPI methodology before interpreting a one-year change; the current WGI documentation before comparing releases; and the OECD UK note before treating criteria fulfilment as an outcome. The government strategy documents intended action, not independent proof that it has succeeded.
The tables and charts are original presentations of the underlying facts, not official TI, OECD or World Bank graphics or endorsements. Suggested reforms, the business illustrations and the final judgement are my interpretation.