
I keep coming back to a fairly simple question. We spend a lot of time arguing about who should get which slice of the national cake. But how do we make the cake bigger?
Not just bigger numbers on a government spreadsheet. More useful things. Better homes. Reliable energy. Businesses that can grow. Public services that work. People who can afford a decent life.
The answer is not simply to work longer or tax somebody else more. A country builds lasting prosperity by improving what its people can produce, maintaining the assets that make that possible, and making the benefits accessible.
That sounds obvious. Actually doing it is rather less straightforward.
Dividing the cake and making it bigger are different jobs
Here is the distinction I wanted to understand. Taking a larger share of the economy in tax can give government more revenue. Increasing the economy can also give government more revenue, even without increasing the share it takes.
These are invented units, not UK figures. For the growth comparison, assume unchanged prices, population and effective tax share.
| Situation | Output | Tax share | Revenue |
|---|---|---|---|
| Starting point | 100 | 35% | 35 |
| Larger share, same output | 100 | 38.5% | 38.5 |
| Larger economy, same share | 110 | 35% | 38.5 |
The revenue increase is the same. Only the last row assumes more real production. The table does not prove that tax changes leave growth unaffected, or that we can order ten per cent growth from a menu.
And it is not a choice between growth and public services. Tax can fund education, health and infrastructure that help people produce more. Badly designed taxes or badly spent revenue can do the opposite.
My concern is that arguing only about the tax share leaves the other question unanswered: what would help people create more useful value in the first place?
First, which cake are we measuring?
Income and wealth are not the same thing. GDP measures production over a period. Wealth concerns the assets we have, including what helps us produce in future.
The World Bank's comprehensive-wealth framework includes buildings and infrastructure, people's education and health, natural resources, and net foreign assets. Its useful question is whether growth strengthens that productive base or uses it up. World Bank wealth framework.
| Measure | What it helps us see | What it misses |
|---|---|---|
| Real GDP | Inflation-adjusted production across the economy | Whether the typical person is better off |
| Real GDP per person | Average production relative to population | Who receives the gains |
| Real output per hour | Production relative to working time | A complete explanation of why it changed |
| Real median disposable household income | The middle household's income after direct taxes and cash benefits, allowing for prices | Everything public services and unpaid work contribute to life |
| National wealth | Assets and future productive capability | Cash everybody can spend today |
For household-income comparisons, it also matters whether the measure adjusts for household size and whether housing costs have been deducted. ONS income definitions.
If we have more people and the same output per person, the total cake is bigger, but the average slice is not. If the value of existing houses rises because homes are scarce, some owners gain while buyers face a harder life.
For me, a wealthier Britain means more capability per person, better living standards and a country we have not worn out to achieve them.
Productivity is not a polite word for working harder
Imagine a carpenter with a blunt saw, unreliable deliveries and three systems that require the same information to be entered repeatedly.
Now give that person better equipment, dependable materials and a sensible way to organise the work. They may produce more, with less waste, in the same hours. That is the sort of improvement we are talking about. It is an example, not a measured national result.
A useful accounting identity is real output = hours worked x real output per hour. Working more hours can increase output. Producing more in each hour is the other route. The identity tells us how to describe the change, not which policy caused it.
And productivity does not mean rushing a nurse, teacher or care worker through more people regardless of quality. A worse service delivered faster is not the improvement I want. Quality, safety and outcomes have to remain part of the judgement.
What actually helps us make more?
There is no single magic ingredient. These are practical mechanisms, not a ranked list of proven GDP gains.
| Ingredient | How it can help | What can go wrong |
|---|---|---|
| Tools and equipment | Better machinery, software and systems reduce waste or enable better work | We buy something nobody can use, or automate the wrong process |
| Skills, health and management | People can perform valuable work and organise it well | We count qualifications instead of useful capability, or ignore barriers to participation |
| Ideas and research | New products, treatments and methods become possible | Experiments fail, or good research never reaches practical use |
| Adoption | Proven methods spread beyond the most advanced organisations | We celebrate one excellent business while others remain stuck |
| Infrastructure and housing | Power, water, transport, communications and homes connect people with opportunities | Costs overrun; capacity is unused; environmental damage outweighs benefits |
| Trade and competition | Businesses reach customers, obtain useful inputs and face pressure to improve | Supply chains become fragile, or incumbents block better alternatives |
| Finance and credible rules | Worthwhile investment becomes fundable, with clearer risks and responsibilities | Money chases existing assets; rules change repeatedly; weak projects get protected |
| Maintenance | We preserve the capability we already paid to create | Neglect turns yesterday's investment into tomorrow's repair bill |
This is my synthesis of the research, not an official formula. The ingredients reinforce one another. A workshop needs people, equipment, customers and power. A technical college needs employers who can use the skills. A new connection is not much use if the business it was built for never opens.
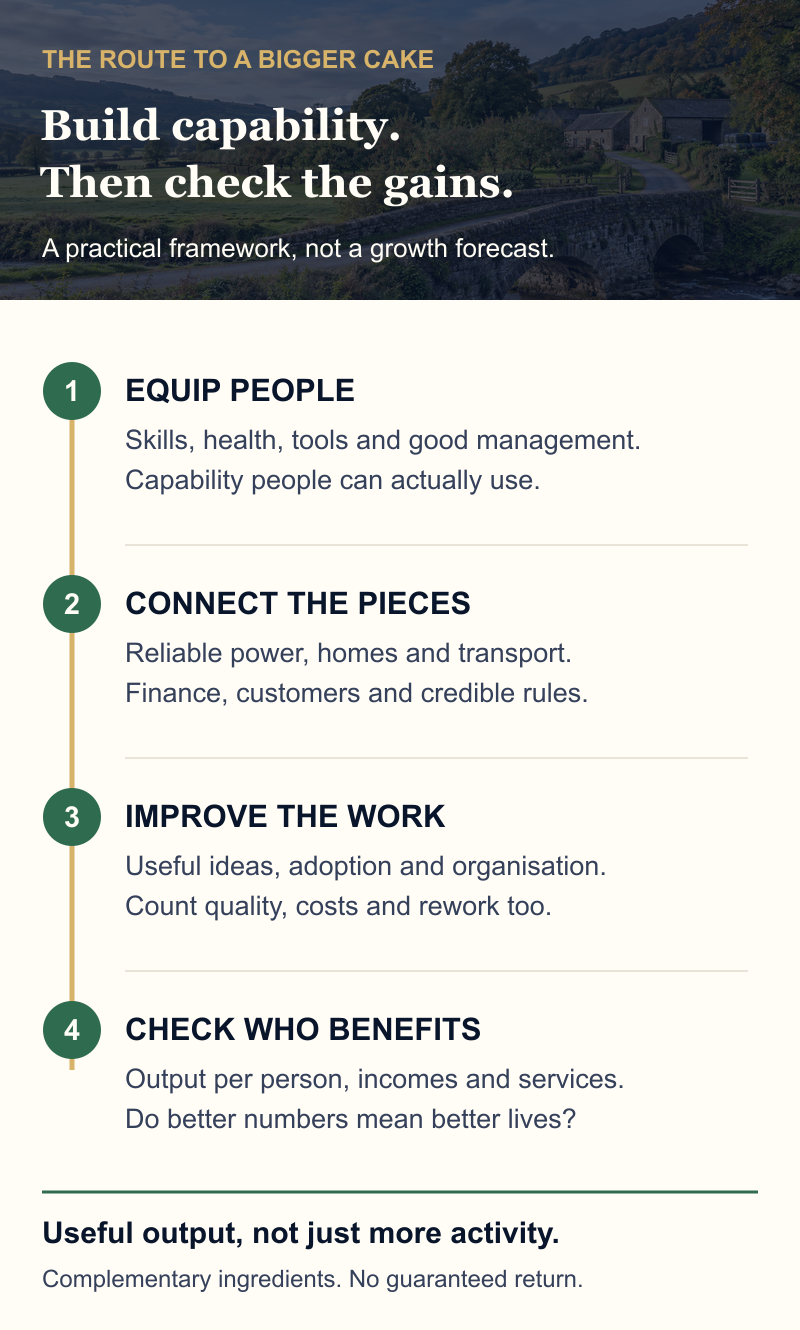
I would rather see fewer announcements and more things that actually work together. A ribbon-cutting is a lovely afternoon. It is not a productivity measure.
Britain's slowdown is real, but the measurements matter
Britain has a productivity problem. We should also be honest when the evidence changes.
The OBR's November 2025 assessment reported these whole-economy real output-per-hour growth averages. They are a dated statistical snapshot, not the latest revised series. OBR, Box 2.1.
| Period | Average annual productivity growth |
|---|---|
| 1998-2007 | 2.1% |
| 2010-2019 | 0.6% |
| 2020-2024 | 0.4% |
There is an important September 2026 update. The ONS's indicative new component-method estimates put average output-per-hour growth at 2.0% in 1997-2007 and 1.3% in 2009-2019, reducing the measured slowdown substantially. These are not yet official statistics. They use different time windows and a different method, so do not splice them into the OBR table. The ONS still identifies a post-financial-crisis slowdown; the change does not increase recorded GDP. ONS explanation; method and indicative-estimate status.
The OECD's 2024 UK survey identified weak investment and policy uncertainty as barriers, with business investment around 11% of GDP in 2023. That is business investment in that year, not all investment or today's ratio. Its July 2026 assessment highlights energy costs, regional productivity gaps and delivery capacity. These are diagnoses, not proof that one policy caused the entire problem. OECD UK 2024; OECD UK 2026.
I do not read that as "Britons should try harder". I read it as a reason to look at what makes capable people and businesses unnecessarily difficult to equip, connect and grow.
What can we learn from other countries?
Quite a lot, provided we do not turn them into political slogans. These are selective examples of mechanisms and institutions, not proof of what caused every country's growth. A country catching up from a lower starting point also has opportunities a mature economy may not have.
| Country | What the evidence shows | What I would take from it |
|---|---|---|
| Germany | Fraunhofer connects applied research with industry. It reports EUR 966 million industrial revenue and 29 spin-offs in 2025. These are the institution's own results, not its measured contribution to national GDP. 2025 report release. | Give businesses practical routes from research to working products. A research network is not a cure for every other constraint. |
| South Korea | The OECD records R&D spending above 5% of GDP in 2022, alongside large productivity gaps between big firms and smaller businesses. OECD Korea 2024. | Frontier innovation matters, but ordinary suppliers must improve too. Research spending alone is not broad prosperity. |
| Singapore | Its government history describes a 1970s strategy combining higher-value foreign investment with workforce upgrading. This is a retrospective account, not a controlled experiment. Singapore's account. | Link investment with skills and delivery. Britain cannot simply copy a small city-state's geography or institutions. |
| United States | NSF estimates businesses funded 75% of all US R&D in 2024, while the federal government funded 40% of basic research. Different denominators; the figures cannot be added. NSF 2026 overview. | Public research and private development can complement one another. Funding shares do not establish who benefits or prove a causal growth effect. |
| China | The World Bank describes investment as a driver of growth, but also declining marginal returns as infrastructure and property capital accumulated. December 2025 update, page 24. | Build useful capacity, not just impressive spending totals. More investment can become poorly allocated investment. |
| Denmark | The OECD describes high living standards and active labour-market support, but a two-speed economy: a few major exporters help headline growth while domestic activity is weaker. OECD Denmark 2026. | Help people move into productive work, and look beyond the stars. A strong national headline can hide weaker everyday experience. |
| Norway | Petroleum receipts have been turned into diversified financial assets; the fund received its first deposit in 1996. Investment values fluctuate. Fund manager's explanation. | Turn temporary windfalls into durable assets. Britain cannot recreate Norway's resource endowment, and a fund is not a productivity shortcut. |
The lesson is not "copy this country's tax rate" or "build whatever it built". It is to understand which capability was created, how it reached businesses and people, and whether the conditions would work here.
Spending more is not the same as building more value
This is where I think we need a little discipline. Calling expenditure "investment" does not make it good investment.
IMF research summarised in 2014 found that well-chosen infrastructure could increase output, with payoffs depending on efficiency and economic conditions. That was a different interest-rate environment; I would not copy its numerical results into a 2026 UK promise. IMF infrastructure analysis.
Another 2014 IMF working paper, by Andrew Warner, found little evidence of lasting gains from historical public-investment drives in its developing-country sample, identifying problems with selection and implementation. Rich countries were excluded, and it did not test infrastructure stimulus during their recessions. This is the author's research, not IMF policy. It does not prove all public investment fails, or settle the case for a British project. It does make "spend more and growth follows" an inadequate plan. Warner's study.
Public or private, I would ask the same questions. Is it needed? Will it be completed? Will people use it? What does it cost over its life? Who maintains it? What better alternative are we giving up?
And if we subsidise something, did the subsidy cause useful activity that would not otherwise have happened? Or did we simply pay for a move from one British town to another?
Where does AI fit into the cake?
This connects directly to why I keep writing about agentics, energy and skills. AI could help organisations research, plan, administer and deliver work more effectively. But access to intelligence is not the same thing as a productivity gain.
My practical chain is: reliable power and compute, usable tools, capable people, better organised work, useful output, then benefits people can actually feel.
We have to test every link. If an agent saves an hour but creates two hours of checking and rework, we have not made the cake bigger. If a business becomes more efficient but cannot reach customers, capacity alone will not deliver the sales.
And if all the savings become extra profit while prices, wages and services do not improve, we should not assume everybody gained. Competition, ownership, bargaining and public policy affect how the benefits are shared. Some people may also lose work before new opportunities become available.
I am optimistic about the opportunity. I am not interested in confusing a model subscription with a national growth strategy.
Small improvements add up
Here is why persistent progress matters. Start an output-per-hour index at 100 and assume a constant annual growth rate. No shocks, no changing population or working hours. This is my own compound-growth illustration, not a forecast.
| Annual growth assumption | After 10 years | After 20 years | 20-year increase |
|---|---|---|---|
| 0.5% | 105.1 | 110.5 | 10.5% |
| 1.0% | 110.5 | 122.0 | 22.0% |
| 1.5% | 116.1 | 134.7 | 34.7% |
| 2.0% | 121.9 | 148.6 | 48.6% |
The calculation is 100 x (1 + annual rate)^years. After twenty years, the 1.5% path is about 10.4% above the 1.0% path. That is not a promise of the same increase in household income or tax revenue.
Still, the arithmetic explains why lots of ordinary improvements, sustained over time, can matter more than one spectacular announcement.
What would I actually ask Britain to do?
This is my judgement from the evidence, not a costed policy programme. We need to make it easier for people to build useful capability, and harder to mistake activity for results.
| Priority | The practical job | The test |
|---|---|---|
| Join up investment | Coordinate homes, commercial space, transport and electricity | Completed capacity, working connections and actual use |
| Train for real work | Connect employers, colleges and portable technical skills | Completion, sustained employment and earnings, not just course starts |
| Help ordinary organisations improve | Spread useful management, processes, software and AI | Better quality and output after implementation, review and operating costs |
| Make good projects investible | Offer credible rules, appropriate finance and routes to customers | Additional productive investment, not just higher asset prices |
| Protect the productive base | Maintain assets and account for environmental and resource costs | Reliability and lasting capability, not a bigger repair backlog |
| Check who benefits | Look at household incomes, affordability, services and opportunity | Better lives across places and groups, not one flattering national average |
The government's Industrial Strategy is a ten-year plan covering eight growth-driving sectors. That tells us the intention. It does not tell us that the resulting prosperity has arrived. UK Industrial Strategy.
I want us to judge it, and any alternative, by what becomes usable. Can the business get its connection? Can the young person get trained? Can the employer obtain the skills? Can the customer afford the service?
I do not want to abandon the argument about fair slices. That matters. But we also need to improve the bakery.
Making the cake bigger means giving people the ability to create more useful value, without running down the country, and making sure the gains become a better life. That is the part I want us to get much more serious about.
Sources and limits
Sources were checked on 4 October 2026. This is a researched explanation, not a systematic review of every country or a model estimating the effects of a UK policy package. Links beside the claims lead to the underlying sources.
Official statistics, forecasts and policy analysis are different types of evidence. OECD and IMF work has analytical assumptions; government histories and operator reports have institutional perspectives. The country examples illustrate possibilities and limitations, not isolated causal proofs. The tax and compounding tables are explicitly invented calculations. My practical recommendations are interpretations, not findings attributed to those institutions.
The productivity section retains the date and method of each estimate. Figures can be revised. No precise spending package, guaranteed AI dividend or claim that growth automatically reaches everyone is established here.